How Many Uninsured? Between 33 and 55 Million
The Centers for Disease Control and Prevention (CDC) has released its latest estimate of uninsured persons in the U.S. in 2013: Between 33 and 45 million. Why so wide a range? CDC analysts appreciate the difference between lacking insurance today and lacking insurance long term:
 In 2013, 44.8 million persons of all ages (14.4%) were uninsured at the time of interview, 55.4 million (17.8%) had been uninsured for at least part of the year prior to interview, and 33.4 million (10.7%) had been uninsured for more than a year at the time of interview.
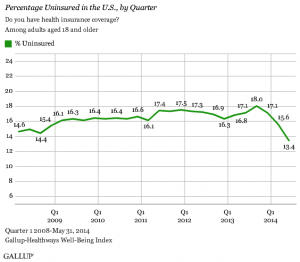
This context has been absent from much of the discussion of ObamaCare’s effects. The most popular estimate of the uninsured nowadays seems to be the Gallup-Healthways Well-Being Index. I discussed the March release, but decided not to cover the June release until the CDC estimate came out. Here’s why:
According to Gallup-Healthways, the 2013 uninsured rate was between 16.8 percent and 18 percent. That figure appears to correspond closely to the CDC’s estimate of people who had been “uninsured for at least part of the year prior to the interview”. Obviously, this question would have the largest number answering “yes”. However, the question that Gallup poses is simply: “Do you have health insurance coverage?” which looks like CDC’s “uninsured at the time of the interview”. For the CDC that figure is only 14.4 percent.
Gallup-Healthways’ latest estimate is that only 13.3 percent are uninsured, which is a big drop. ObamaCare cheerleaders jumped on this apparent success. However, there are discrepancies between Gallup-Healthways’ estimates and others’ that need to be reconciled before we can read much into its increasingly popular survey.


Let’s say 50 million uninsured for grins. Then a drop of say, 5% means 2.5 million less, which leaves still 47.5 million uninsured. For a sweeping reform, doesn’t look like that much to me.
But for 2.5 million people, it is life changing! And for everyone else, just business as usual.
“For a sweeping reform, doesn’t look like that much to me.”
Probably because people are not willing to buy into the scam.
Regardless, there are much more uninsured than those who are insured through ObamaCare. I don’t hear anyone touting these numbers, especially once everyone has to pay the uninsured penalty.
Also that ObamaCare helped insure 7-8 million people, which is about 15% of what the uninsured is. If any policy had that kind of success rate, it should be thrown out immediately. Especially considering its high cost.
The Gallop and CDC have differences in their data. Proponents and skeptics will jump on either side that supports their argument, but we need more definitive conclusions and unbiased data.
This is something that I absolutely agree with and that will likely continue to be a problem. We as the public get given these massively contrasting figures with either side shouting the numbers that further their agendas, and the public is stuck here trying to figure out who’s lying the most.
The U.S. Census Bureau has always admitted that its survey that is supposed to track year-long uninsured is closer to a snapshot in time. There were estimates years ago that perhaps only 20 million people were actually in need of assistance. The rest were either eligible for Medicaid, had sufficient income to afford coverage or healthy enough to easily pay for routine care out of pocket.
Since the uninsured rate can fluctuate often, they would be much better off providing “snapshot” like timeframes, as opposed to an individual year.
That is true. There was another survey, the Survey of Income and Program Participation (SIPP) that surveyed every month, but it lost funding and is not frequently done any more.
The 44.8 million figure is probably the ceiling for a reasonable estimate of how many are actually uninsured. It is a fair representation of how many are uninsured at a given date, even though the actual number may vary over time. It would be the most responsive to changes in policy and economic climate.
The 55 million figure is not useful in the same way, since it counts people who are no longer uninsured.
The 33 million figure is not especially useful either, unless the question specifically concerns long-term uninsurance or unemployment. But changing from “more than a year” to “more than 60 days” might be a useful refinement to the 44 million figure.