Category: Health Care Costs

Private Sector Health Benefits Grew 17 Percent Faster Than Wages Last Year

bls
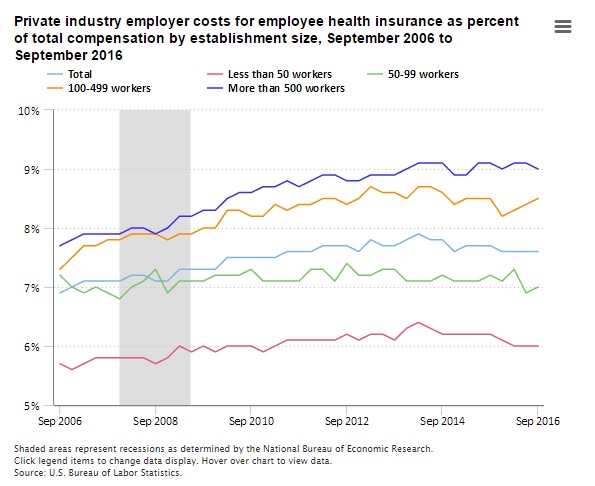
Released yesterday, the Bureau of Labor Statistics quarterly Employment Cost Index showed private sector health benefits increased 2.7 percent in 2016, versus only 2.3 percent for wages.

Overall, private-sector benefits grew only 1.8 percent, indicating non-health benefits would have grown little if at all. State and local government workers’ benefits grew 3.1 percent, 72 percent faster than private-sector benefits!

Read More » »

Bernie Sanders’ Single-Payer Utopia

Back in October I wrote “Is Obamacare’s Failure Intentional, to Promote Medicaid-for-All?”  In it I discussed how Bernie Sanders famously advocated for single-payer socialized medicine during his campaign. In 2011, the Vermont legislature passed a bill to create a single-payer initiative known as Green Mountain Care. In 2014 it was abandoned by Vermont’s governor — a Democrat — as being too costly. Green Mountain Care was going to require an 11.5 percent payroll tax and an additional sliding-scale income tax that topped out at 9.5 percent. Despite the heavy tax burden, a single-payer system in Vermont was projected to run deficits by 2020.

Read More » »

GDP: Tame Health Spending In Weak Report

BEAFor those (like me) concerned about how much health spending continues to increase after Obamacare, today’s flash report of fourth quarter Gross Domestic Product confirmed good news.

Overall, real GPD increased 1.9 percent on the quarter, while health services spending increased only 1.6 percent, and contributed only 10 percent of real GDP growth. Growth in health services spending was somewhat higher than growth in non-health services spending (1.2 percent) but significantly lower than non-health personal consumption expenditures (2.7 percent). Further, the implied annualized change in the health services price index increased by just 1.5 percent, lower than the price increase of 2.4 percent for non-health services, 2.3 percent for non-health PCE, and 2.2 percent for non-health GDP.

(See Table I below the fold.)

Read More » »

CPI: Moderate Health Price Increases

blsThe Consumer Price Index rose 0.3 percent in December. Medical prices rose only 0.2 percent. This is the fourth month in a row we have enjoyed medical price relief. Even prices of prescription drugs rose by only 0.2 percent. Prices of health insurance even dropped a smidgeon!

Prices for medical care commodities rose the most, by 0.6 percent, followed closely hospital services (0.3) percent).

Over the last 12 months, however, medical prices have increased over twice as fast as non-medical prices: 1.9 percent versus 4.1 percent. Price changes for medical care contributed 16 percent of the overall increase in CPI.

Many observers of medical prices decline to differentiate between nominal and real inflation. Because CPI is has been low until recently, even relatively moderate nominal price hikes for medical care are actually substantial real price hikes. More than six years after the Affordable Care Act was passed, consumers have not seen relief from high medical prices, which have increased over twice as much as the CPI less medical care since March 2010, the month President Obama signed the law.

(See Figure I and Table I below the fold.)

Read More » »

PPI: Pharma Prices Are Dropping!

BLSDecember’s Producer Price Index rose 0.3 percent. However, prices for most health goods and services grew slowly, if at all. Fifteen of the 16 price indices for health goods and services grew slower than their benchmarks.*

The outlier was health and medical insurance for final demand, which increased by 0.2 percent, the same rate as final demand services (less trade, transportation, and warehousing.) The largest decline (relative to its benchmark) was for prices of new health care building construction, which declined twice as fast as prices of overall building construction did.

Prices of hospital outpatient care and nursing home care declined versus their final demand services (less trade, transportation, and warehousing) and also absolutely. Pharmaceutical prices decreased 0.1 percent, a 0.4 percent drop versus the price increase for final demand goods less food and energy.

See Table I below the fold:

Read More » »

Health Jobs Explode Versus Non-Health Jobs

blsHealth jobs exploded in this morning’s jobs report, growing more than three times faster than non-health jobs (0.28 percent versus 0.09 percent). With 43,000 jobs added, health services accounted for over one quarter of 156,000 new nonfarm civilian jobs.

The disproportionately high share of job growth in health services is a deliberate outcome of Obamacare. While this trend persists, it will become increasingly hard to carry out reforms that will improve productivity in the delivery of care.

Ambulatory sites added jobs at a much faster rate than hospitals (0.41 percent versus 0.21 percent). This was concentrated in offices of physicians, which alone added. Ambulatory sites added 30,000 jobs, versus 11,000 in hospitals. This is a good sign because hospitals are high-cost locations of care versus doctors’ offices and other ambulatory sites.

See Table I below the fold:

Read More » »

GDP: Health Spending Almost Flat

BEAFor those (like me) concerned about how much health spending continues to increase after Obamacare, the third report of third quarter Gross Domestic Product confirmed good news. Although GDP growth was revised up $14.5 billion from the second report, spending on health services was revised downward. It is good to have a breather from the second quarter, which was dominated by growth in health services spending.

Overall, real GPD increased 3.5 percent on the quarter, while health services spending increased only 0.6 percent, and contributed only 2 percent of real GDP growth. Growth in health services spending was also significantly lower than other services spending and personal consumption expenditures (PCE). However, the annualized change in the health services price index increased by 1.8 percent, lower than the price increase of 2.8 percent in non-health services, slightly more than the 1.4 percent price increase in non-health PCE, and non-health GDP.

(See Table I below the fold.)

Read More » »

Obamacare’s Effect on Employers’ Health Costs

The Bureau of Labor Statistics has published a chart showing how health benefit costs among private employers have increased over the past decade. The chart shows health benefits increased from 6.9 percent of total compensation in September 2006 to 7.6 percent last September. The 0.7 percentage point absolute increase is a relative increase of ten percent.

chart1

Read More » »

The Health Care Costs Quandary: What Can Be Done About It?

yuI recently attended a roundtable discussion that included Human Resource (HR) executives, chief financial officers (CFOs), benefits brokers, consultants and providers who discussed ways self-insured employer plans can lower their health care costs. The meeting was hosted by a state-of-the-art hospital that is part of a small chain of medical facilities, including emergency rooms, imagine, clinics, orthopedic hospitals.

Read More » »

CPI: Dramatic Drop In Prescription Drug Prices

blsThe Consumer Price Index rose 0.2 percent in November. Remarkably, medical prices were flat overall. This is the third month in a row we have enjoyed medical price relief. Prices of prescription drugs dropped by 0.6 percent. Even the prices of health insurance and hospitalization dropped a smidgeon!

Prices for physician services rose the most, by 0.6 percent, followed closely by other medical professionals (0.5 percent).

Over the last 12 months, however, medical prices have increased 2.7 times faster than non-medical prices: 1.5 percent versus 4.0 percent. Price changes for medical care contributed 20 percent (one fifth) of the overall increase in CPI.

Many observers of medical prices decline to differentiate between nominal and real inflation. Because CPI is has been low until recently, even relatively moderate nominal price hikes for medical care are actually substantial real price hikes. More than six years after the Affordable Care Act was passed, consumers have not seen relief from high medical prices, which have increased over twice as much as the CPI less medical care since March 2010, the month President Obama signed the law.

(See Figure I and Table I below the fold.)

Read More » »