GDP: Health Spending Almost Flat
 For those (like me) concerned about how much health spending continues to increase after Obamacare, the third report of third quarter Gross Domestic Product confirmed good news. Although GDP growth was revised up $14.5 billion from the second report, spending on health services was revised downward. It is good to have a breather from the second quarter, which was dominated by growth in health services spending.
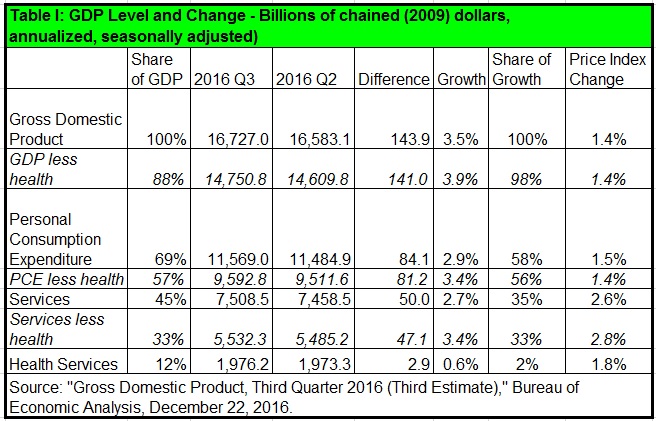
Overall, real GPD increased 3.5 percent on the quarter, while health services spending increased only 0.6 percent, and contributed only 2 percent of real GDP growth. Growth in health services spending was also significantly lower than other services spending and personal consumption expenditures (PCE). However, the annualized change in the health services price index increased by 1.8 percent, lower than the price increase of 2.8 percent in non-health services, slightly more than the 1.4 percent price increase in non-health PCE, and non-health GDP.
(See Table I below the fold.)
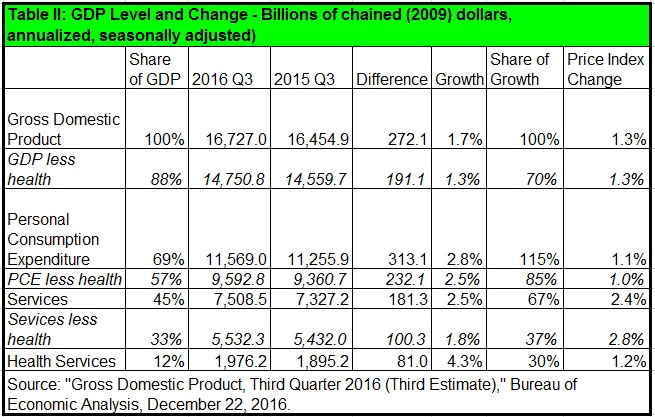
Longer term, growth in health services spending is still disproportionately high, having grown 4.3 percent since 2015 Q3, versus 1.8 percent for non-health services, 2.5 percent for non-health PCE, and just 1.3 percent for non-health GDP (Table II). However, this appears not to be driven by price increases, which were in line with overall GDP price increases.
Recent releases for the Consumer Price Index and the Producer Price Index also suggest downward pressure on health prices. However, while the quarterly GDP release has a category for health services within services, it does not have a category for health goods within goods.
Technical note: Until the July 29, 2016 entry on the GDP release, I discussed nominal GDP growth. As of August 26, 2016, these updates discuss real GDP growth, in line with the way most media cover GDP. However, as of the October 28, 2016 entry, I add a column that estimates changes in the price indices, calculated from the news release.
When I discuss health services in these quarterly GDP releases, I mean only health services. I do not include purchases of medical equipment, or facilities construction. While I include Medicare and Medicaid, I do not include Veterans Health Administration or other government benefits. So, these dollar figures undercount the amount of our economy consumed by the government-health complex.
(See: Measuring the Economy: A Primer on the GDP and the National Income and Product Accounts, Bureau of Economic Analysis, October 2014, pages 5-2 and 5-3; Micah B. Hartman, et al., “A Reconciliation of Health Care Expenditures in the National Health Expenditures Accounts and in Gross Domestic Product,” Research Spotlight, Survey of Current Business, September 2010, pages 42-52.)


