Tag: "economic data"

Hospitals Dominate Health Jobs In November

BLS
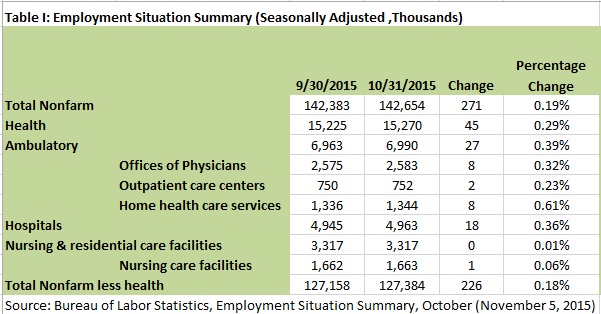
The November Employment Situation Summary came in as expected, with 211,000 nonfarm civilian jobs added. Last month’s report was dominated by health jobs, which was not the case today. The increase of 24,000 health jobs comprised only 11 percent of the payroll hike, and both health and non-health jobs rose by 15 percent on the month (Table I).

TI

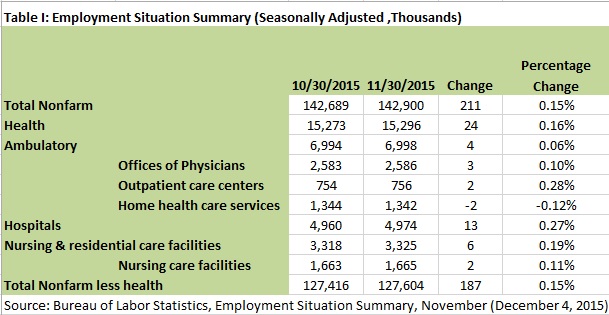
However, hospital jobs, which increased 13,000, comprised over half the growth in health jobs. This is something we view with concern. We prefer to see health jobs grow in ambulatory settings, because hospitals are the most expensive location of care. Hopefully, technology will move more health services out of the hospitals.

Read More » »

Big Jump in Public Health Facilities Construction in October

After a significant drop in September, health construction starts increased significantly in October: A 1.3 percent increase versus a 1.0 percent increase for other construction starts (see Table I). On a twelve-month basis health facilities construction is still positive, but has been running slower than the booming non-health construction market: 6.1 percent versus 13.3 percent.

20151201 Construction

Read More » »

GDP: Health Services Accounts for 30 Percent of Services Spending Growth

BEAToday’s second estimate of Gross Domestic Product for the third quarter indicates growth in health services spending is maintaining a disproportionate share of still slow GDP growth.

Spending on health services grew faster (5.0 percent, annualized, in current dollars) than spending on non-health services (3.9 percent) or non-health personal consumption expenditure (3.0 percent) from the second quarter (Table I). The growth in health services spending ($25.1 billion, annualized) accounted for 17 percent of all GDP growth ($151.0 billion), one fifth of personal consumption expenditure ($130.2 billion), and 30 percent of all services spending ($85.5 billion).

Read More » »

CPI: Medical Prices Rose Three Times Faster Than Other Prices; Hospitals Stand Out

BLSOctober’s Consumer Price Index (CPI) confirms medical prices continue to spring ahead of prices for other goods and services. Overall CPI increased 0.2 percent on the month and also 0.2 percent, year on year. Medical prices, on the other hand, increased 0.7 percent on the month and 3.0 percent, year on year (Table I).

20151117 CPI

Read More » »

PPI: Health Prices Continue to Rise Faster Than Others

October’s Producer Price Index declined 0.4 percent, month on month, and dropped 1.6 percent, year on year. Mild deflation continues to take hold in the general economy. However, it is not so in health care. Of the 14 sub-indices for health-related goods and services, only three declined month on month. Only six declined year on year (see Table I).

20151113 PPIa

Read More » »

Health Jobs Dominate Great Jobs Report

BLSObservers cheered the October Employment Situation Summary, which reported 271,000 civilian nonfarm jobs added. This is a big turnaround from the September report, which was very disappointing. Nevertheless, the two months have one thing in common: Jobs in health services dominated the growth in jobs. Whether job growth overall is strong or weak, health care keeps increasing its share.

Health care accounted for 45,000 of the 217,000 jobs added overall in October (Table I). That’s a rate of growth of 0.29 percent, much higher than 0.18 percent growth in non-health jobs. Jobs in ambulatory facilities accounted for 27,000 of the increase, which hospital jobs only increased by 18,000. Ambulatory jobs now account for a significantly higher share of health jobs than hospitals do. This change is positive, because hospitals are inefficient and overly expensive facilities for many procedures.

20151105 Health Workforce TI

Read More » »

Significant Drop in Private Health Facilities Construction in September

After an uptick in August, health construction starts declined significantly in September: A 0.1 percent decline versus a 0.6 percent increase for other construction starts (see Table I). On a twelve-month basis health facilities construction is positive, but running slower than the booming non-health construction market: 9 percent versus 14.3 percent.

20151102 Construction

The short-term decline occurred entirely among private health facilities, for which starts declined 0.3 percent. When looking only at private construction, health facilities and other building starts are at about the same rate of growth for the twelve-month period. Maybe it was time for a breather in September.

Read More » »

Health Services Accounts for One Fifth of Weak Q3 GDP Growth

BEAToday’s advance estimate of Gross Domestic Product for the third quarter indicates growth in health spending is maintaining a disproportionate share of weak GDP growth. Commenters noted that the weak estimate was largely due to shrinking inventories. This explains why personal consumption expenditure (PCE) growth ($135.7 billion) was actually higher than GDP growth ($121.1 billion), quarter on quarter (Table I).

20151029 GDP T

Read More » »

CPI: Deflation Except In Health Care (Again)

I admitBLS this is getting a little repetitive, but it is not my fault the Bureau of Labor Statistics (BLS) releases the Consumer Price Index one day after the Producer Price Index. The CPI confirms (once again) the price behavior indicated by yesterday’s PPI.

While consumer prices were down 0.2 percent, month on month, and flat year on year, medical prices increased 0.2 percent and 2.5 percent (Table I). However, prescription drugs experienced quite moderate price increases last month. This means that while prices of medical goods and services overall increased, month on month, there was no sticker shock versus the CPI. Unfortunately, yesterday’s PPI suggests that price increases are flowing through the system again, and we can expect to see a pick-up in health prices versus overall inflation, in future CPIs.

Read More » »

PPI: Deflation Except in Health Care

BLSSeptember’s Producer Price Index declined 0.5 percent, month on month, and dropped 1.1 percent, year on year. A mild deflation appears to be taking hold in the general economy. However, it is not so in health care. Of the 14 sub-indices for health-related goods and services, only five declined month on month. Only three declined year on year (see Table I).

20151014 PPI

Read More » »