Tag: "CBO"

Tim Kane Critiques the Obama Presidency

Here is the scorecard on Obama’s fiscal promises, according to the CBO: the deficit in 2008 was 0.5 trillion dollars. Federal outlays were 2.98 trillion dollars. Since then, the U.S. government has run deficits of 1.4, 1.3, 1.3, and a projected 1.17 trillion dollars during these last four years…with outlays of 3.5, 3.5, 3.6 and a projected 3.4 trillion dollars (through 11 months of the 2012 fiscal year)…

Instead of cutting the deficit in half, Obama has tripled it. Instead of controlling spending, he’s raised outlays by half a trillion dollars a year, which will get much bigger when the health care law takes effect. Instead of a temporary stimulus to bridge the nation back to full GDP, we have a permanently stimulated federal government and zero recovery.

It is entirely understandable that the deficit was not fixed in the first year that Obama was in the White House, the second year, the third year, and even the fourth year. What is not understandable is the absence of any coherent long-term plan, partisan or bi-partisan, to address the issue. What America got instead was another blue-ribbon commission (Simpson-Bowles) that was ignored before the ink on its final report was dry.

Entire post by Tim Kane in the Balance blog.
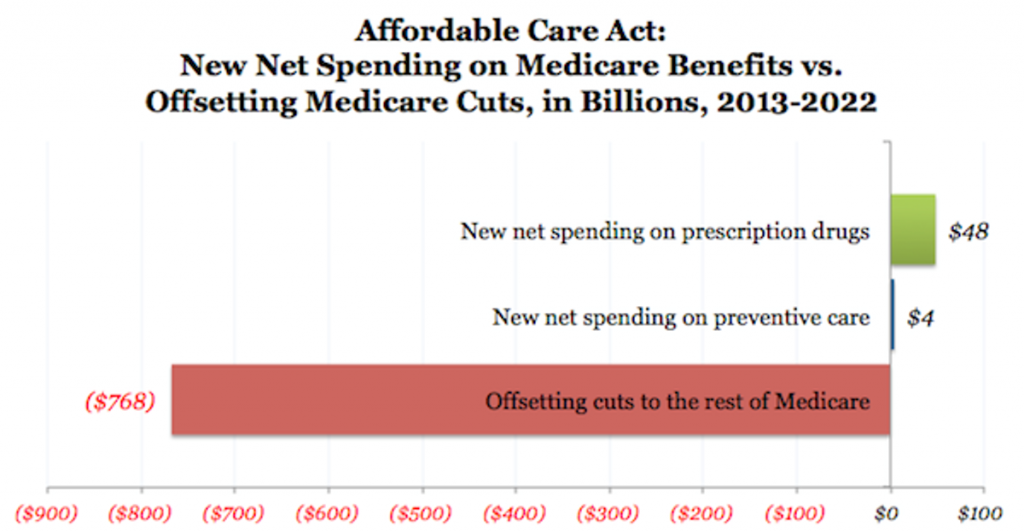
ACA Effects on Seniors: Costs Exceed Benefits by 15 to 1

[A]ccording to the Congressional Budget Office, for every $500 the law spends on preventive services and prescription drugs, it cuts the rest of Medicare by $7,385. That’s a cut-to-spending ratio of nearly 15 to 1.


Sources: Avik Roy, CBO.

Sunbelt Counties Will Suffer Under ObamaCare

The Congressional Budget Office recently published new estimates on how the Patient Protection and Affordable Care Act (ACA) would cut about $716 billion from Medicare over a 10-year period (2013 to 2022). This included $415 billion from Fee-for-Service (FFS) Medicare and $156 billion from Medicare Advantage (MA) plans — in addition to other cost-cutting provisions. The cuts work out to about $15,000 fewer dollars per enrollee.

Robert Book and Michael Ramlet have updated their analysis of the impact of Medicare cuts by state and county. One startling factoid: three states that are havens for seniors — Texas, California and Florida — stand to lose a combined $148 billion. Two counties in Florida — Broward and Dade County — stand to lose nearly $10 billion combined. Two counties in Texas — Harris County (Houston-area) and Dallas County — stand to lose nearly $11 billion combined.

Kudos to Ezra’s Blog

With all the talking heads out there defending the indefensible (see the previous post), let me stop to praise Dylan Matthews at the Ezra Klein blog for calling it straight. Here is a sample of his analysis of a Mitt Romney ad:

Obama is raiding $716 billion from Medicare – This one’s true. The most recent CBO analysis of the Affordable Care Act, released last month, estimated the 10-year Medicare cuts in the bill at $740 billion, so if anything the ad’s number is low.

Pinocchio’s for Axelrod

This is David Axelrod on ABC’s This Week, talking about the $700 billion ObamaCare takes from Medicare to pay for health insurance for non-seniors:

Let’s talk about the $700 billion. Congressman Ryan, what he doesn’t say is that he’s incorporated that same $700 billion into his plan, so he’s embraced exactly what the president’s done. The difference is the president is trying to strengthen the Medicare program. Under the changes that the president made, seniors are getting more prescription coverage and preventive care. We extended the life of Medicare by eight years, according to the Congressional Budget Office.

Ah, but Ryan would apply the $700 billion to deficit reduction, removing future pressure to make even more Medicare cuts. President Obama, on the other hand, would spend every penny. How do you help Medicare by robbing Peter to pay Paul? You don’t. Here is Chris Jacobs:

The non-partisan CBO said that the Medicare reductions in ObamaCare “will not enhance the ability of the government to pay for future Medicare benefits” — because those savings will be used to fund other unsustainable entitlements. If the President wants to use the Medicare savings provisions to extend the life of the Medicare trust fund — and not to fund the new entitlements created by the law — the Congressional Budget Office previously estimated what the fiscal impact would be: “A net increase infederal deficits of $260 billion” through 2019.

Would Abolishing ObamaCare Increase the Deficit?

In a letter to John Boehner last week, the Congressional Budget Office estimates that abolishing the Affordable Care Act would increase the deficit by $109 billion over the next ten years. Is this estimate credible? The CBO is required to assume the ACA is implemented the way the law is written. But the law requires $523 billion in cuts to Medicare. These are cuts that the Office of the Medicare actuaries say will cause one in seven hospitals to close by the end of the decade and will keep seniors from having reasonable access to physicians. This outcome is so unbelievable that the CBO has published an “alternative report” showing much higher Medicare spending and the Medicare Actuaries Office not only publishes an “alternative report,” they are now including the alternative report in the official report.

Bigger Cuts for Medicare

See my previous post on what has to happen for the Affordable Care Act to reduce the deficit. An American Action Forum analysis reports that it’s worse than I thought:

[T]he CBO estimates that the ACA will cut Medicare spending by $741 billion over the next 10 years, up from the roughly $500 billion advertised at passage (see page 5, table 2 — Medicare and Other Medicaid and CHIP Provisions). This change reflects both the fact that the budget window is different, and that in the absence of cuts, Medicare is growing quite rapidly. Accordingly, the size of the cuts [is] growing rapidly as well.

The Progressivity of Public Policies

Are the rich paying their fair share? Here from Greg Mankiw are taxes minus transfer benefits as a percent of market income:

Bottom quintile: -301 percent.
Second quintile: -42 percent.
Middle quintile: -5 percent.
Fourth quintile: 10 percent.
Highest quintile: 22 percent.
Top one percent: 28 percent.

Greg comments:

The negative 301 percent means that a typical family in the bottom quintile receives about $3 in transfer payments for every dollar earned. The most surprising fact to me was that the effective tax rate is negative for the middle quintile. According to the CBO data, this number was +14 percent in 1979 (when the data begins) and remained positive through 2007. It was negative 0.5 percent in 2008, and negative 5 percent in 2009. That is, the middle class, having long been a net contributor to the funding of government, is now a net recipient of government largess.

How Much Does ObamaCare Really Cost?

The original 10-year cost estimate of $940 billion made in 2010 covered 2010-2019. Hence, the public was told health reform would cost less than $1 trillion. But the law is not fully implemented until 2018. So the actual ongoing 10-year cost will be more fully disclosed with each passing year, until full implementation is reached in 2018. In 2012, the CBO cost was updated to be $1.8 trillion. By 2013, the cost will be about $2 trillion. By 2018, the full implementation 10-year costs will be closer to $2.5 trillion.

Source: Ron Bachman for the Georgia Public Policy Foundation.

Headlines I Wish I Hadn’t Seen

CBO: Federal debt to double in 15 years.

HHS has missed nearly half of ObamaCare legal deadlines.

Bloomberg bans food donations to the homeless.