The Welfare State
This is from Catherine Rampell, writing at The New York Times’ Economix blog:
Source: Bureau of Economic Analysis, Credit Suisse
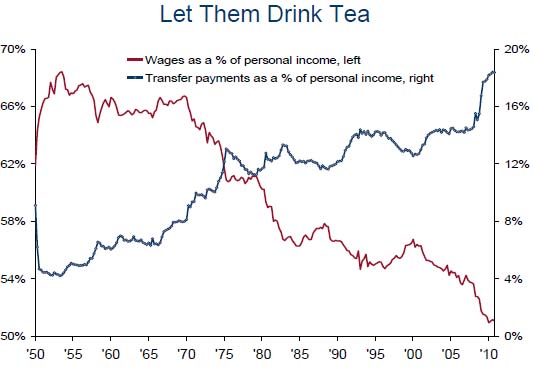
The red line shows what share of personal income comes from wages — that is, what Americans earn from working. The blue line shows what share comes from transfer payments, which are made to individuals, usually by the federal government, through social benefit programs like unemployment insurance, disability insurance and Social Security. (Note that the two lines use different scales, shown on the vertical axes, and that the scale for wages does not start at zero.)
As you can see, the share of income that Americans earn by working has been falling, from more than two-thirds of their income in the mid-1950s to just over half of their income today. Meanwhile, they have been growing more and more dependent on money from social benefits programs, growing from about 4 percent in the mid-’50s to about 18 percent in February 2011.


What did Sen. Simpson say? We have 310 million people all sucking at the public …..
What a misleading graph–thanks for the note on the axes, at least, but there is no reason they couldn’t have put both quantities on the same axis except that it wouldn’t have had quite the impact.
Good point, Linda. Still, I find the trends depressing.
Regardless of the magnitudes, the trends are bad.
Good point Linda. Deliberately obfuscating the data always help to prove a point. I would love to see another trend line showing the change (in real terms) of middle class earnings or perhaps the poverty line since 1950.
I agree that the axis does provide a visually skewed interpretation. However, if one looks at the magnitude of change between 2000 and 2010 there is roughly a 5% increase in transferred funds, and also a 5% reduction in wages as a % of personal income. This is interesting from a tax revenue standpoint, but there is not enough information to evaluate this.
It should also be noted that personal income is the sum of earned income (wages) and unearned income (dividends, capital gains, stocks, etc). This graph has little meaning without total personal income or unearned income. One could get the same graph if unearned income increased greater as a percent of personal income.
So basically Americans only work for 51% of their income and receive another 18% as transfers. If this trend continues, there won’t be enough people let working to pay for all the transfers.
Interesting chart. The trend takes place over 60 years, so you’re looking at a gradual slope. But, it is alarming. It’s not so much the percentage of transfer payments but the fact that at some point, too many people receive transfer payments.
I wonder what happens when people realize that those wonderful transfer payments don’t really inflate their income as would be expected. Government promises are often difficult to deliver.
Simon, I think for the median family, “unearned income” is not a large share of total income. For the country as a whole it is substantial, however.
Simon: You have nailed it. Also, even if current personal income from dividends, coupons, etc. is not significant, it will be as we age and retire. It should be added to the wages for the narrative purpose of this graph, and to extrapolate into the future.
(I’m afraid I don’t know enough about national accounts to know how those payments are categorized. Even though the IRS doesn’t “see” them until they leave the 401(k), I think the System of National Accounts (SNA) should recognize them as income in the current year, if it doesn’t).
Alongside Linda Gorman’s comment about the axes, I’ve decided not to get in as much of a panic about this graph as I initially thought I would – although it still makes me uneasy!
The graphs may be off-axis, but they _are_ to the same scale.
Simon:
While addding unearned income would make the graph more accurate, it is a moot point for most Americans. The top 10% of households own 85% of all financial assets.
Don Levit