Tag: "Health Care Costs"

GDP: Health Services Are 39 Percent of Growth

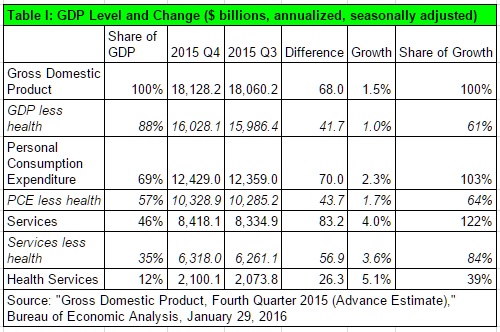
BEAToday’s advance release of Q4 GDP showed the production of goods actually shrank in the fourth quarter. As a result, the (annualized) $26.3 billion growth in health services spending accounted for 39 percent of GDP growth of $68.0 billion. It comprised 32 percent of services spending growth and 38 percent of growth in personal consumption expenditure (Table I). This means that health services spending continues to devour more of our budgets. The evidence continues to indicate Obamacare is not bending the cost curve.

20160129 TI

Read More » »

CPI: Prescription Prices Finally Drop Amid General Deflation

BLSMedical prices grew 0.1 percent, versus a decrease of 0.1 percent for all other items, in December’s Consumer Price Index. Prices for prescription drugs actually decreased 0.3 percent, even better than the small price increase in the Producer Price Index (PPI).

Prices for physicians’ services were flat, however, whereas they had jumped in the PPI. Because CPI measures prices as observed by consumers and PPI prices as observed by producers, this suggests that prices paid to physicians by non-consumers (i.e., third parties) have increased more than prices paid by consumers. This supports the principle that when consumers face prices directly, prices go up less than when intermediated by third parties.

Overall, medical care inflation was tame in December. Longer term, it still significantly outpaced the CPI other than medical care, by two percent over the year (Table I).

Read More » »

PPI: Physician Prices Jump Amidst Deflation

BLSThe stock market took a hit this morning, as the Producer Price Index turned back to deflation, dropping 0.2 percent in December and 0.1 percent in 2015 (Table I). Health prices are still growing faster than other prices. This is especially true for pharmaceuticals, for which prices increased 8.2 percent last year, versus a 3.7 percent decline in prices for final demand goods. Although political attacks on pharmaceutical prices are misguided, it is likely they will continue as long as this situation persists.

With respect to services, health price inflation is not as extreme. However, the jump of 1.3 percent for physician prices in December is remarkable.

Read More » »

GDP: Health Services Growing Faster Than Personal Consumption Expenditures

BEAReleased on December 22, the third estimate of Gross Domestic Product for the third quarter indicates growth in health services spending is maintaining a disproportionate share of still slow GDP growth.

Spending on health services grew faster (4.8 percent, annualized, in current dollars) than spending on non-health services (3.9 percent) or non-health personal consumption expenditure (4.2 percent) from the second quarter (Table I). The growth in health services spending ($24.8 billion, annualized) accounted for 17 percent of all GDP growth ($146.5 billion), just under one fifth of personal consumption expenditure ($130.6 billion), and 29 percent of all services spending ($84.7 billion).

Read More » »

CPI: Hospitals Under Pressure As Physician Prices Rise

BLSNovember’s Consumer Price Index (CPI) indicates health prices are moderating, though still increasing higher than non-heath consumer goods. In the third piece of bad news for hospitals (from their perspective, at least, after the Quarterly Services Survey and the Producer Price Index), prices for hospital services actually dropped (See Table I).

Read More » »

QSS: Dramatic Drop In Hospital Profitability in 3rd Quarter

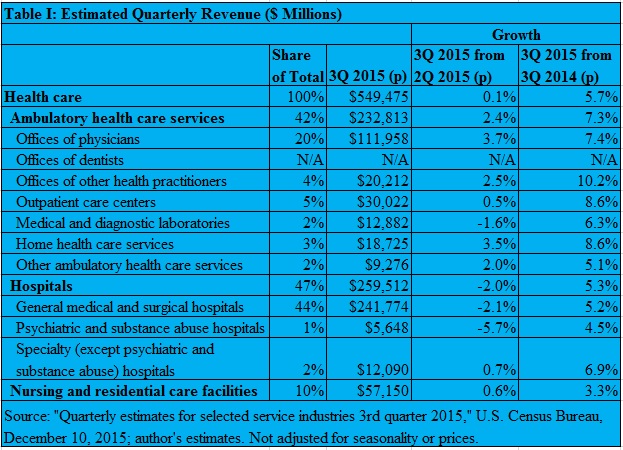
The latest Quarterly Services Survey (QSS) showed a dramatic turnaround in hospitals’ fortunes. Quarterly revenues dropped two percent from the 2nd quarter, while offices of physicians and home health services grew over three percent (see Table I). Hospital revenue grew only 5.3 percent from 2014 Q3 to 2015 Q3, but that was still significantly lower than growth for most other health services.

TI

In the previous QSS, I discussed the healthy rise in hospital margins. That has changed dramatically. The Q3 data is subject to revision. Nevertheless, it indicates a dramatic change in hospitals’ fortunes (see Table 2).

Read More » »

PPI: Pharmaceutical Prices Finally Tame In November

BLSNovember’s Producer Price Index (PPI) finally saw a slowdown in pharmaceutical price increases, which increased 0.3 percent, month on month. This was the same as the overall PPI increase. Price increases for health goods and services were very slight, compared to general PPI. Indeed, two categories (X-Ray & electromedical equipment and biological products including diagnostics) actually experienced price deflation (see Table I).

Read More » »

Why Are U.S. Prescription Prices Higher?

Variety of Medicine in Pill BottlesJeanne Whalen of the Wall Street Journal has written a feature article comparing U.S. prescription drug prices to those overseas. Unsurprisingly, she find prices in other developed countries lower, and credits government price controls in other countries with (pretty much) all the difference.

A vial of the cancer drug Rituxan cost Norway’s taxpayer-funded health system $1,527 in the third quarter of 2015, while the U.S. Medicare program paid $3,678. An injection of the asthma drug Xolair cost Norway $463, which was 46% less than Medicare paid for it.

Drug prices in the U.S. are shrouded in mystery, obscured by confidential rebates, multiple middlemen and the strict guarding of trade secrets.

The state-run health systems in Norway and many other developed countries drive hard bargains with drug companies: setting price caps, demanding proof of new drugs’ value in comparison to existing ones and sometimes refusing to cover medicines they doubt are worth the cost.

(Jeanne Whalen, “Why the U.S. Pays More Than Other Countries for Drugs,” Wall Street Journal, December 1, 2015)

I do not dispute the facts of the article, but the article’s misidentifying the primary reason why drug prices are different. It actually does a good job of differentiating countries where the state exercises monopsony power over drug purchases (like Norway) and those where the state does not exercise purchasing power, but imposes price controls on al sales (like Canada). It is easy and intuitive to conclude that such government interventions reduce prices. However, contrary evidence shakes that thesis. Relative purchasing power better explains the difference.

Read More » »
GDP: Health Services Accounts for 30 Percent of Services Spending Growth

BEAToday’s second estimate of Gross Domestic Product for the third quarter indicates growth in health services spending is maintaining a disproportionate share of still slow GDP growth.

Spending on health services grew faster (5.0 percent, annualized, in current dollars) than spending on non-health services (3.9 percent) or non-health personal consumption expenditure (3.0 percent) from the second quarter (Table I). The growth in health services spending ($25.1 billion, annualized) accounted for 17 percent of all GDP growth ($151.0 billion), one fifth of personal consumption expenditure ($130.2 billion), and 30 percent of all services spending ($85.5 billion).

Read More » »

CPI: Medical Prices Rose Three Times Faster Than Other Prices; Hospitals Stand Out

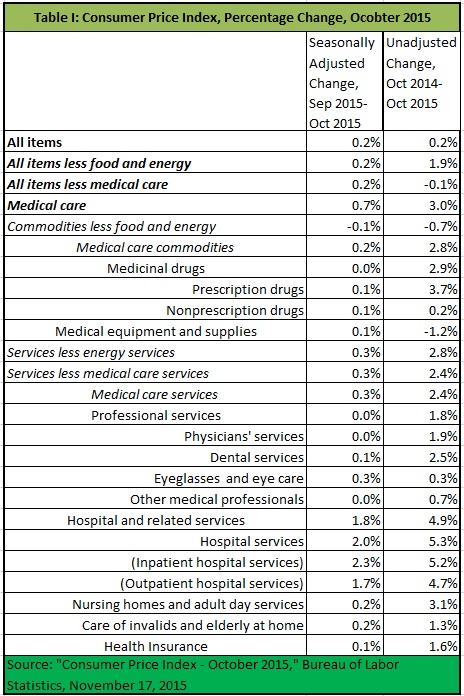
BLSOctober’s Consumer Price Index (CPI) confirms medical prices continue to spring ahead of prices for other goods and services. Overall CPI increased 0.2 percent on the month and also 0.2 percent, year on year. Medical prices, on the other hand, increased 0.7 percent on the month and 3.0 percent, year on year (Table I).

20151117 CPI

Read More » »