Tag: "economic data"

CPI: Health Insurance Premiums Jump Amid General Deflation

BLSThis morning’s Consumer Price Index corroborates yesterday’s Producer Price Index, which indicated health insurance and certain other health prices increased in a generally deflationary environment. While the CPI for all items dropped 0.2 percent in February, health insurance increased 1.3 percent. Over the last twelve months, CPI has increased just 1.0 percent, while health insurance has increased 6.0 percent.

Prescription drugs continue to stand out, as well, having increased 0.9 percent last month and 3.4 percent over twelve months. However, the increase in prescription prices alone cannot explain the health insurance premium hikes.

Inpatient hospitals services also stand out, having increased 0.6 percent last month and 4.8 percent in the last twelve months. Outpatient services are only slightly better.

February’s CPI confirms that, while nominal increases in health prices are moderate, real price increases are quite high, because we are in a generally deflationary environment.

(See Table I below the fold.)

Read More » »

PPI: Health Insurance Jumps, Deflation Returns

BLSDeflation returned to the Producer Price Index (PPI) last month, as the PPI for final demand dropped 0.2 percent from January. Prices for final demand goods, less volatile food and energy, increased 0.1 percent. Most prices for health goods for final demand were flat. The exception – again – was pharmaceutical preparations, for which prices increased 1.2 percent.

With respect to final demand services, for which inflation was flat (or up 0.3 percent less trade, transportation, and warehousing), the increase in the price of health insurance stands out at 0.9 percent. This is the first jump in health insurance for a while. (Home health prices also increased 1 percent, but such increases have been common.)

With respect to goods for intermediate demand, prices for chemicals (which go into pharmaceutical preparations) decreased, but not by nearly as much as prices for other intermediate goods declined. With respect to services for intermediate demand, prices for health insurance increased by 0.9 percent, significantly more than prices for other intermediate services.

Looking back over the 12-month period, the price increase of 10.1 percent in pharmaceutical preparations continues to stand out like a sore thumb. However prices for services delivered in residential settings have also increased more than other services.

What is new for February is the increase in health insurance. Increasing health costs are finally being passed on through premiums. (See Table I below the fold.)

Read More » »

QSS: Revenue Growth Strong in Health Services, Hospital Profitability Recovered

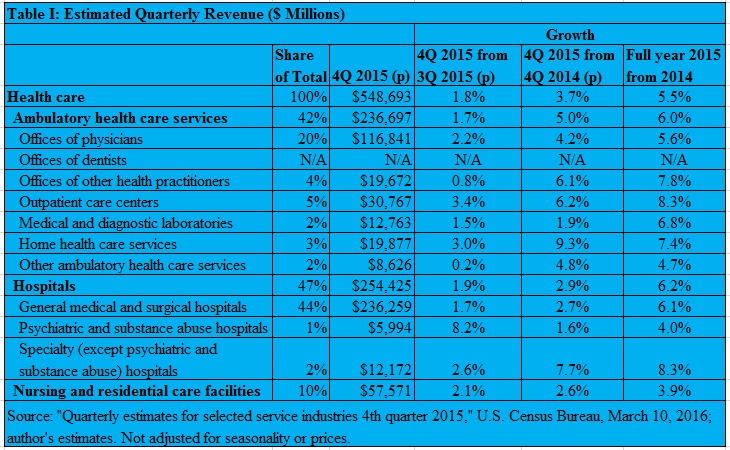
Census2This morning’s Quarterly Services Survey (QSS) from the Census Bureau showed 2015 was a good year for revenue growth in health services. Overall, fourth quarter revenue grew 1.8 percent on the quarter, 3.7 percent from Q4 2014, and 5.5 percent year on year (Table I).

20160310 T1

Revenue growth in psychiatric and substance abuse hospitals really blew the doors off in Q4, increasing 8.2 percent. However, this looks idiosyncratic. Q4 2014 to Q4 2015 growth was only 1.6 percent, and year on year growth was 4.0 percent.

Read More » »

Health Jobs Still Grow Faster Than Other Jobs

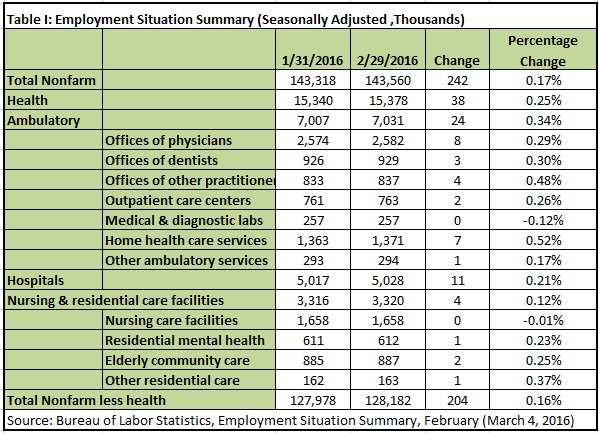
BLSThe latest jobs report was greeted as good news, with nonfarm payroll increasing by 242,000 jobs in February. Health services jobs accounted for 38,000 (16 percent) of the growth. Health services jobs accounted for a smaller share of job growth than in previous months. Nevertheless, they grew faster (0.25 percent) than other nonfarm jobs (0.16 percent) (Table I).

20160304 TI

Read More » »

Health Construction Still Very Weak in January

Census2Construction of new health facilities remained very weak in January, shrinking 0.1 percent since December, while other construction grew at 1.6 percent (Table I).

The rate of decline in public health facilities continued to be dramatic at 5.0 percent, versus booming 4.8 percent growth in other public construction starts. Private health facilities construction grew 1.3 percent in slow private construction market, which grew just 0.5 percent.

Over the last twelve months, health facilities construction starts have lagged other construction significantly. This suggests health systems are pessimistic about their ability to extract further revenue from the system.

Read More » »

GDP: Health Services Are 29 Percent of Growth

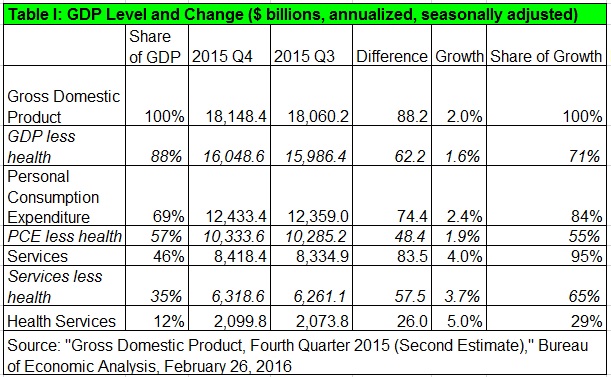
BEAToday’s second release of Q4 GDP showed the production of goods actually shrank in the fourth quarter. As a result, the (annualized) $26 billion growth in health services spending accounted for 29 percent of GDP growth of $88.2 billion. It comprised 31 percent of services spending growth and 35 percent of growth in personal consumption expenditure (Table I). This means that health services spending continues to devour more of our budgets. The evidence continues to indicate Obamacare is not bending the cost curve.

20160226 TI

Read More » »

CPI: Health Insurance Premiums Jump

BLSThis morning’s Consumer Price Index showed a significant jump of 1.1 percent in health insurance premiums in January, versus a flat CPI for all items and a 0.3 percent rise in CPI for all items less food and energy. Prices for physician services increased only 0.1 percent, less than prices for other services.

This corroborates the Producer Price Index, which showed a slight decrease in physician prices. However, the divergence in price increases for prescription drugs in the CPI and PPI is continuing. Prescription prices in the CPI increased by only 0.5 percent, in line with medical care overall.

Over the last twelve months, prices for medical care still increased a little more than twice as fast as the CPI for all items, and 0.7 percentage points more than the CPI for all items less food and energy. Relatively speaking, medical inflation is not as tame as some others suggest.

Further, over the past twelve months, price increases for health insurance and hospital services stand out significantly more than price increases for prescription drugs. (See Table I below the fold.)

Read More » »

PPI: Physician Prices Pull Back

BLSDecember’s surprising jump in physician prices looks to have been idiosyncratic. January’s Producer Price Index for physician services declined 0.6 percent, versus a 0.5 percent rise in prices of final demand services. Prices for home health and hospice care increased 0.7 percent on the month. However, other prices for final demand health services were in line with other services inflation.

For final demand goods, prices for pharmaceutical preparations increased 1.6 percent, versus zero change for final demand goods less food and energy. (When the next Consumer Price Index is released on February 19, we will see whether the divergence between pharmaceutical prices in the PPI and CPI continues.) With respect to intermediate demand goods, prices of biologics, including diagnostics, increased 1.1 percent, versus a 1.3 percent decline in prices of processed goods, less foods and feeds.

It does not look like complaints about high and increasing prices for pharmaceuticals and biologics will be going away soon. (See Table I below the fold.)

Read More » »

Huge Health Jobs Hike, Especially in Hospitals

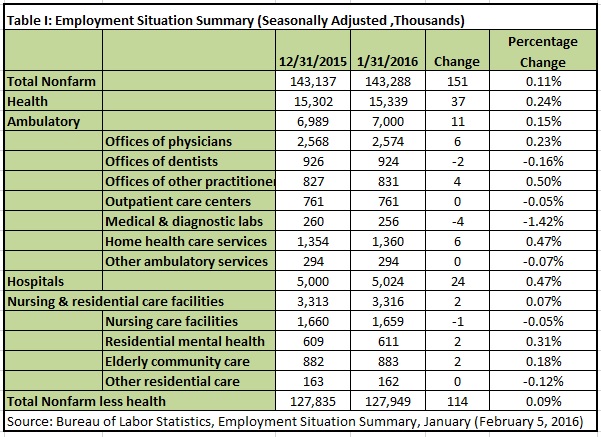
BLSThis morning‘s tepid jobs report (Employment Situation Summary) was dominated by health services, which added 37,000 jobs in January. That is just one percentage point shy of one quarter of all nonfarm civilian jobs added (Table I).

Within health care, hospitals dominated, accounting for 24,000 of the 37,000 increase – almost two thirds. (This is interesting because there has been a slowdown in health construction starts. So, there must be a lot of slack in already built facilities.) Hospitals are generally inefficient locations of care, so the pickup in employment in January is actually of concern because it likely indicates more expensive care.

20160205 TI

Read More » »

Health Construction Collapses in December

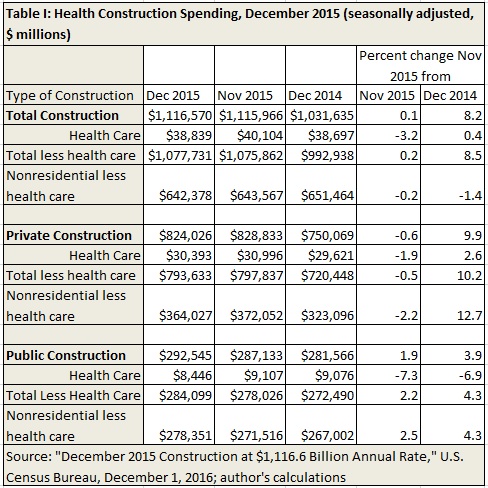
Construction of new health facilities collapsed in December, shrinking 3.2 percent since November, while other construction eked out growth of 0.2 percent (Table I).

20160201 Construction

Most of the decline occurred in public health facilities, for which construction starts shrank 7.3 percent, versus 2.2 percent growth in other public construction starts. Private health facilities construction shrank 1.9 percent in a shrinking private construction market.

Over the last twelve months, health facilities construction starts have lagged other construction significantly. This suggests health systems are pessimistic about their ability to extract further revenue from the system.