Tag: "economic data"

PPI: Pharma Price Hikes Continue To Stand Out

BLSThe Producer Price Index (PPI) for final demand goods grew 0.2 percent last month, or 0.3 percent less food and energy. Prices for pharmaceutical preparations and most medical devices grew significantly faster, at 1.0 percent and 0.5 percent, although prices for X-Ray and similar equipment were flat.

With respect to final demand services, for which prices rose 0.1 percent (or 0.3 percent, less trade, transportation, and warehousing), prices of medical services changed similarly. However, prices for health insurance jumped 0.8 percent.

With respect to goods for intermediate demand, which dropped 0.3 percent, price increases for biologics, including diagnostics, stood out at 2.5 percent. With respect to services for intermediate demand, which rose 0.1 percent, prices for health insurance jumped 0.8 percent

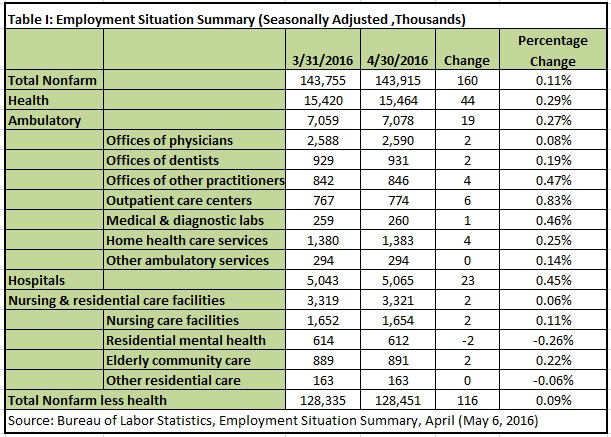
Looking back over the 12-month period, the price increase of 10.4 percent for pharmaceutical preparations continues to stand out like a sore thumb. Political agitation against drug prices is unlikely to go away soon. Health insurance, having risen 1.7 percent in a flat or negative inflationary environment, is also beginning to stand out. (See Table I below the fold.)

Read More » »

Health Jobs Grow More Than Three Times Faster Than Other Jobs

BLSHealth services jobs grew over three times faster than non-health, nonfarm civilian jobs in April. Health services jobs comprised 44,200 (28 percent) of 160,000 jobs added. The rate of growth from March was 0.29 percent for health services jobs versus only 0.09 percent for other jobs (Table I).

20160506 TI

Read More » »

Health Construction Boomlet Continues

Census2The boomlet in health construction, first noted in last month’s Census Bureau release, continued in March. Health facilities construction starts grew 1.6 percent, while other construction grew only 0.3 percent (Table I).

The rate of growth was significantly greater for public health facilities (2.3 percent) than private health facilities (1.4 percent). Further, the relative growth was much larger for public health facilities, because non-health public construction declined by 2 percent, while non-health private construction grew 0.7 percent.

This is the second month of uptick in health facilities construction. Over the last twelve months, health facilities construction starts have grown only half as fast as non-health starts (4.1 percent versus 8.2 percent). It is too early to say whether the boomlet in health facilities construction indicates a trending upturn. However, it suggests health systems are beginning to be optimistic about their abilities to continue to extract revenue from the system.

Read More » »

Flash GDP: Health Services Over One Third of GDP Growth

BEAThis morning’s advance (flash) estimate of GDP for the first quarter (usually subject to significant future revision) showed very weak growth dominated by spending on health services. Health services spending of $19.5 billion (annualized) comprised over one third of GDP growth. However, there was shrinkage in personal consumption expenditures on goods, private domestic investment, and exports. This meant personal expenditures on services grew almost twice as much as GDP growth. Growth in spending on health services amounted to a little less than one fifth of growth in services spending. Nevertheless, the quarterly growth in spending on health services indicates health services continues to consume a disproportionate share of (low) growth (Table I).

20160428 GDP T1

Read More » »

U.S. Health Spending Not An Economic Burden

HSA(A version of this Health Alert was published by Forbes.)

Health spending consumes a higher share of output in the United States than in other countries. In 2013, it accounted for 17 percent of Gross Domestic Product. The next highest country was France, where health spending accounted for 12 percent of GDP. Critics of U.S. health care claim this shows the system is too expensive and a burden on our economy, demanding even more government intervention. This conclusion is misleading and leads to poor policy recommendations, according to new research published by the National Center for Policy Analysis (U.S. Health Spending is Not A Burden on the Economy, NCPA Policy Report No. 383, April 2016).

Discussing health spending in dollars, rather than proportion of GDP, the report notes Americans spent $9,086 per capita on health care in 2013, versus only $6,325 in Switzerland, the runner-up. (These dollar figures are adjusted for purchasing power parity, which adjusts the exchange rates of currencies for differences in cost of living). This big difference certainly invites us to question whether we are getting our money’s worth. However, it is not clear that this spending is a burden on Americans, given our very high national income.

Read More » »

CPI: Most Medical Price Hikes Stall

BLSThe Consumer Price Index for March indicates that medical price inflation matched changes in other prices charged to consumers, with a slight uptick of 0.1 percent. Prescription drugs (0.5 percent increase), nursing homes and adult day care, eyeglasses, and health insurance (all with 0.4 percent increases) stood out as continuing to experience higher inflation than other items. Prices for many health goods and services actually dropped.

However, over the last twelve months, medical prices faced by consumers have grown much faster than non-health prices: 3.3 percent versus 0.6 percent. Prescription prices increased 3.4 percent. However, inpatient hospital services and health insurance prices increased much faster, by 5.9 percent and 6.0 percent.

When we compare the medical components of the CPI with those in the Producer Price Index, it appears that hospitals, not drug makers, are shifting more prices directly onto consumers.

(See Table I Below the fold.)

Read More » »

PPI: Pharmaceutical Prices Up Amid Deflation

BLSDeflation in the Producer Price Index (PPI) continued last month, as the PPI for final demand dropped 0.1 percent from February. Prices for final demand goods, less volatile food and energy, increased 0.2 percent. Most prices for health goods for final demand were flat. The exception – again – was pharmaceutical preparations, for which prices increased 0.4 percent.

With respect to final demand services, for which prices dropped 0.2 percent (or increased just 0.1 percent, less trade, transportation, and warehousing), prices of medical services changed little. Even the price of health insurance remained flat, after an increase in February.

With respect to goods for intermediate demand, prices for chemicals (which go into pharmaceutical preparations) increased by just 0.1 percent, while prices of biologic products (including diagnostics) dropped the same percentage. With respect to services for intermediate demand, prices for health insurance remained flat, although prices for other intermediate services declined.

Looking back over the 12-month period, the price increase of 9.8 percent in pharmaceutical preparations continues to stand out like a sore thumb. Political agitation against drug prices is unlikely to go away soon. (See Table I below the fold.)

Read More » »

Health Jobs Grow Over Two Thirds Faster Than Other Jobs

BLSHealth jobs grew more than two thirds faster than non-health jobs in March. Health jobs comprised 37,000 (17 percent) of nonfarm civilian jobs added (215,000). The rate of growth from February was 0.24 percent for health jobs versus only 0.14 percent for non-health jobs (Table I).

20160401 TI

Read More » »

Boomlet in Health Construction In February

Census2Construction of new health facilities enjoyed a boomlet in February, growing 2.0 percent, while other construction shrank 0.6 percent (Table I).

The rate of growth in construction starts was similar for both private and public health facilities, at 2.0 percent and 1.7 percent. However, the relative growth was much larger for public health facilities, because non-health public construction declined much more than non-health private construction (a drop of 1.8 percent versus a drop of 0.2 percent).

This is the first uptick in health facilities construction in a while. Over the last twelve months, health facilities construction starts have lagged other construction starts by 7.2 percent (10.5 percent growth versus 3.3 percent growth). It is too early to say whether February’s boomlet in health facilities construction indicates a downturn. However, it suggests health systems are beginning to be optimistic about their abilities to continue to extract revenue from the system.

Read More » »

2015 GDP: Health Services Spending Grew More Than Twice As Fast as Non-Health GDP

BEALast Friday’s release of the third estimate of Q4 Gross Domestic Product and annual GDP confirmed spending on health services grew at more than twice the rate of growth in non-health GDP in 2015.

For Q4, the third estimate significantly reduced the share of GDP allocated to health services from the previous second estimate (Table I). At $18.7 billion (annualized), growth in health services spending accounted for almost one fifth of GDP growth. This was sa much faster rate of growth (3.6 percent) than for non-health GDP (2.1 percent). Almost all Q4 GDP growth was in services, not goods. Personal consumption expenditure on goods actually dropped.

2016 GDP TI

Read More » »