Tag: "economic data"

PPI: Health Prices Up Among Zero Overall Inflation

BLSAs with July’s Producer Price Index, health price inflation is no longer eye-popping, but still higher than overall PPI, which was flat in August. Hospital outpatient care stands out, with prices having risen 1.1 percent, monthly. Other price increases were moderate, but only prices of X-Ray machines and electromedical equipment declined.

This is also true over the last twelve months. Pharmaceutical prices especially stand out, even though they have risen moderately for a few months. It will take a while for the trend of high prices hikes from a few months ago to break down. Nursing homes, for which prices rose 3.0 percent, might replace drug makers as the whipping boy for high health prices, but they have a long way to go.

(See Table I below the fold.)

Read More » »

QSS: Strong Health Services Revenue Growth in 2nd Quarter

Census2This morning’s Quarterly Services Survey showed strong revenue growth in health services. Overall, revenues grew 3.6 percent in Q2 versus Q1 and 6.7 percent versus Q2 2015. For the first half, revenues grew 5.9 percent versus H1 2015. Growth was positive in all sectors except specialty hospitals. Physicians’ offices led the growth, at 4.5 percent. This is a turnaround from Q1. Perhaps most surprising was medical and diagnostic labs, for which revenue grew 4.0 percent. Labs have shed jobs, so increasing revenue suggests productivity improvements.

See Table I below the fold:

Read More » »

Significant Job Losses in Nursing Homes A Drag On Health Job Growth

BLSThis morning’s jobs report was somewhat weaker than expected, adding 151,000 jobs versus 180,000 expected. For the first time in many months, job growth in health services slightly lagged growth in non-health jobs (0.09 percent versus 0.11 percent).

However, there was a significant divergence within health services: Jobs in ambulatory care and hospitals jumped 0.16 percent and 0.21 percent, while nursing homes shed 7,000. That imposed a massive drag on health services overall, limiting growth to 14,000 jobs (Table I).

Read More » »

Significant Divergence in Private Vs. Public Health Facilities Construction in July

Census2The divergence between private and public health facilities construction continued in July. Overall, health facilities construction starts increased 0.3 percent in July, versus zero for other construction. However, there was a significant difference between the private and public segments.

Construction of private health facilities dropped 0.3 percent, versus an increase of 1.0 percent for other private construction. Construction of public health facilities increased a whopping 2.5 percent, versus a drop of 3.2 percent for other public construction (Table I).

Is this what they mean by “infrastructure” spending – broken bridges and roads, while more VA and county hospitals spring up?

Read More » »

GDP: Health Services Grow Over Five Times Faster Than “Sluggish” Non-Health GDP

BEAToday’s second estimate of second quarter Gross Domestic Product confirms spending on health services is dramatically outpacing other “sluggish” GDP growth. Fixed investment, durable goods, and inventories continued to collapse, while imports increased. Therefore, growth in services spending grew much faster than GDP. In real (inflation-adjusted) dollars, services grew 4.3 percent (annualized, seasonally adjusted). As a large component of services, health services grew 3.8 percent.  While real GDP growth was 1.1 percent, once health services is stripped out, non-health GDP grew just 0.7 percent (Table I).

(See Table I below the fold.)

Read More » »

CPI: Medical Prices Continue Upward March

BLSThe Consumer Price Index for July was flat. Medical prices, however, continued their upward march, increasing by one half of one percentage point. If prices for medical care had been flat, the CPI would have declined by 0.1 percent. Prescription drugs, physicians’ and other medical professionals’ services, and health insurance stand out even within medical care.

Over the last twelve months, prices for medical care have increased almost seven times faster than prices for non-medical items in the CPI. Price increases for medical care have contributed 40 percent of the overall CPI increase.

Many observers of medical prices decline to differentiate between nominal and real inflation. Because CPI is flat, even relatively moderate nominal price hikes for medical care are actually substantial real price hikes. Consumers are seeing no relief from high medical prices.

Read More » »

PPI: Health Price Inflation Low, But Not Low Enough

BLSThis morning’s Producer Price Index came in unexpectedly low, decreasing 0.4 percent versus an expected slight increase of 0.1 percent. Except for nursing home care, which increased 0.9 percent, producer prices for medical goods and services decreased or increased very modestly. Of 15 medical goods and services measured in the PPI, four actually experienced price decreases over the month. This number includes pharmaceutical preparations. However, because overall PPI actually deflated significantly, all medical prices increased at a faster rate than the overall PPI.

Over the last twelve months, prices for all but one medical category (medical lab and diagnostic imaging services) have increased faster than overall PPI. At 6.3 percent (versus just 0.3 percent for final demand), producer prices for pharmaceutical preparations stand out. However, the monthly PPI suggests this trend might be breaking down. Nursing homes, for which producer prices increased 2.5 percent might replace drug makers as a target of politicians’ campaigns against health costs, but they have a long way to go.
(See Table I below the fold.)

Read More » »

Health Services Jobs Grew 75 Percent Faster Than Non-Health Jobs

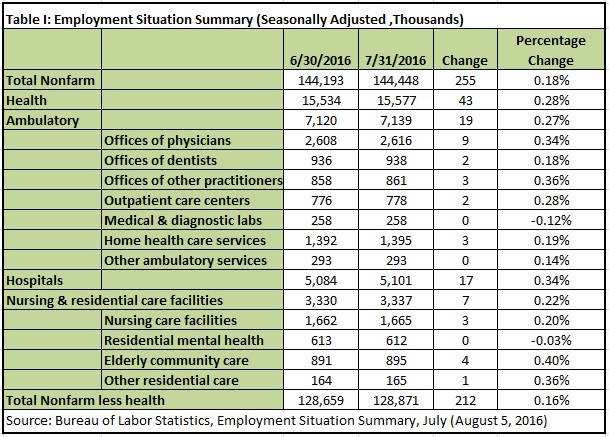
BLSThis morning’s jobs report was the second month in a row of good news on the employment front. However, like last month’s report, jobs in health services grew much faster than non-health jobs. Health services added 43,000 jobs in July comprising 17 percent of the 255,000 civilian non-health, non-farm jobs added (Table I). The monthly rate of growth in health services jobs was 75 percent more than for other jobs. The shifting of jobs towards the government-controlled health sector continues.

TI

Read More » »

Health Construction Shrinks Twice As Fast As Other Construction in June

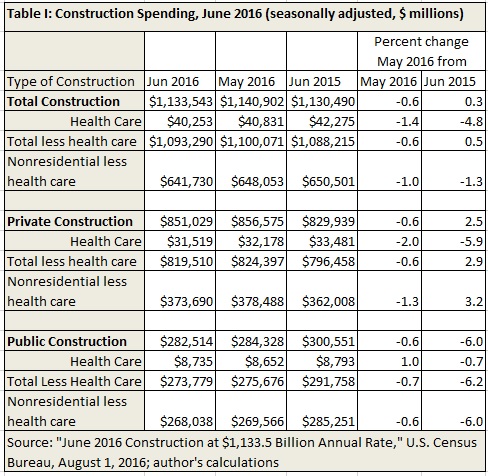
Census2The see-saw in health facilities construction continues. Health construction starts dropped 1.4 percent in June, versus a drop of 0.6 percent for other construction (Table I). However, there was a significant difference between the private and public segments.

TI

Read More » »

GDP: Health Services Spending Dominates “Close To Zero” Economic Growth

BEAAs the U.S. economy continues to flirt with recession, this morning’s “flash” Dross Domestic Product release for the second quarter indicates “close to zero” growth. Business investment has collapsed, leaving personal consumption expenditures to drive what little growth there is.

As a large component of personal consumption expenditures, spending on health services continues to outpace GDP growth. Growth in health services spending of $28.4 billion (annualized) comprised 18 percent of GDP growth. However, personal expenditures on services grew much more than GDP overall. Growth in spending on health services amounted to 15 percent of growth in personal consumption expenditures and 25 percent of spending on services. Spending on health services grew by 5.3 percent, versus only 3.2 percent growth in non-health services GDP (Table I).

Read More » »