Search Results for 'producer price index'

Consumer Price Index: Amid Disinflation, Medical Prices Increasing

BLSYesterday’s Consumer Price Index (CPI) release confirmed prices of medical goods and services continue to rise at a steady pace, despite the general deflationary environment. The CPI declined 0.1 percent from July to August (seasonally adjusted), and increased just 0.2 percent in the last twelve months.

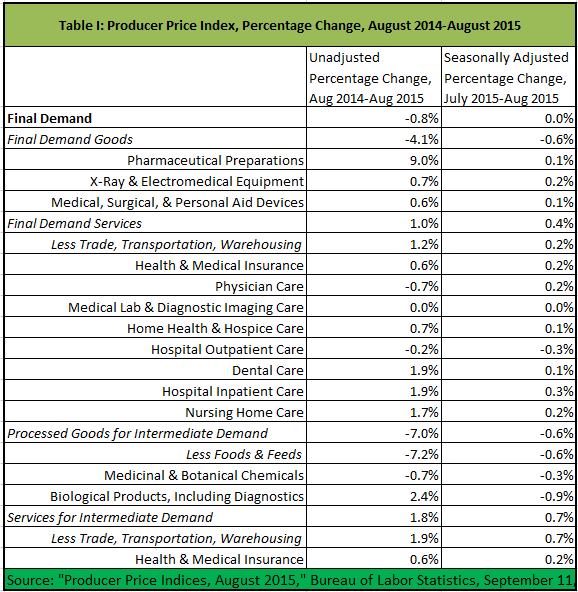
Much of the disinflation is caused by dropping energy prices. Excluding food and energy, the CPI increased 0.1 percent last month and 1.8 percent over the last twelve months. Medical care, although flat last month, increased 2.5 percent over the last twelve months (see Table I). This is moderate by historical standards, but still excessive relative to current CPI.

PPI: Gap in Hospital Inpatient & Outpatient Prices

BLSAugust’s Producer Price Index was flat, month on month, and dropped 0.8 percent, year on year, continuing the trend we saw last month. Producer prices for health goods and services are rising faster than other producer prices (see Table I).

20150911 TI

Health-Related Producer Prices Tame in July

BLSThe Producer Price Index (PPI) for July increased more than expected, but was still benign. Health-related producer prices were tame last month.

Prices for pharmaceutical preparations, which have increased faster than other producer goods in the long term (rising 9.4 percent since July 2014), finally turned around and actually dropped 0.4 percent last month (See Table I). This was a bigger decline than prices for all final demand goods (-0.1 percent) or for all final demand (0.2 percent).

Producer Prices: Health Goods & Services Lag

Last Friday’s Producer Price Index showed a jump from April to May of 0.5 percent (seasonally adjusted). When I last looked at the PPI, it looked like prices of health goods and services were outpacing other producer prices.

The latest data show them lagging (see Table 1). Although, looking at year-on-year data, pharmaceutical products, hospitals, and nursing homes have had relatively high price increases. Price inflation for health insurance has been moderate, according to the PPI.

Health Goods Prices Rise; Other Prices Fall

Last Friday’s release of the Producer Price Index  for February confirms that prices for health goods and services are rising at a much higher rate than other producer prices, most of which are declining significantly.

As shown in Table 1, prices of goods for final demand actually dropped 4.2 percent over the last twelve months. However, prices of pharmaceutical preparations increased by 7.1 percent; and prices of medical, surgical, and personal-aid devices also crept up.

20150313 PPI

Prices for intermediate goods tell a similar story, with prices for medicinal, botanical, and biological chemicals experiencing higher price growth than other processed chemicals.

Prices for services sends a much less clear signal, being distributed around an increase of 1.2 percent for all demand services. (Health insurance is categorized as both a final and intermediate services, as it is sold both retail and wholesale.)

Prices of services are more important than prices of goods in determining overall health price inflation. Nevertheless, there is no evidence that Obamacare is holding down prices of health services.

(The Altarum Institute has also released its updates of health spending and prices, which show strong growth in health spending of 5 percent in 2014 and high relative price inflation.)

Prices for Health Goods Rallying

As the economy slowly crawls its way back towards growth, inflation is well under control. However, healthcare inflation is rearing its head. Table 1 presents data from the February release of the Producer Price Index.

Over the last twelve months through January, producer prices increased by zilch, and actually decreased since last December. Prices of goods for final demand actually dropped 3.7 percent over the year. Pharmaceutical preparations, however, increased by 7.3 percent, and other healthcare goods also had higher inflation than other goods for final demand (which, I hate to state, also weakens the argument that the medical-device excise tax is having as negative an effect as the industry claims).20150219 PPI


GDP: Health Spending Almost Flat

BEAFor those (like me) concerned about how much health spending continues to increase after Obamacare, the third report of third quarter Gross Domestic Product confirmed good news. Although GDP growth was revised up $14.5 billion from the second report, spending on health services was revised downward. It is good to have a breather from the second quarter, which was dominated by growth in health services spending.

Overall, real GPD increased 3.5 percent on the quarter, while health services spending increased only 0.6 percent, and contributed only 2 percent of real GDP growth. Growth in health services spending was also significantly lower than other services spending and personal consumption expenditures (PCE). However, the annualized change in the health services price index increased by 1.8 percent, lower than the price increase of 2.8 percent in non-health services, slightly more than the 1.4 percent price increase in non-health PCE, and non-health GDP.

(See Table I below the fold.)

GDP: Tame Health Spending Confirmed In Strong Report

BEAFor those (like me) concerned about how much health spending continues to increase after Obamacare, the second report of third quarter Gross Domestic Product confirmed good news. Although GDP growth was revised up $10 billion, only a scratch was due to health spending. It is good to have a breather from the second quarter, which was dominated by growth in health services spending.

Overall, real GPD increased 3.1 percent on the quarter, while health services spending increased only 2.3 percent, and contributed only 9 percent of real GDP growth. Growth in health services spending was also in line with other services spending and personal consumption expenditures (PCE). However, the annualized change in the health services price index increased by 1.7 percent, lower than the price increase of 1.3 percent in non-health GDP but less than the 2.8 percent price increase for non-health services.

(See Table I below the fold.)

CPI: Medical Inflation Finally Under Control

BLSThe Consumer Price Index (CPI) for April confirmed medical inflation is matching the broad measure of price changes. For the second month, price changes for medical care (0.3 percent) were in line with all-items (0.4 percent). Although, it looks like a jump in energy prices drove the CPI up. If energy price increases moderate, we can expect prices for medical care to increase faster than CPI.

With respect to medical commodities, it prices of prescription drugs continued to increase faster than other medical commodities or commodities over all. Although, pharmaceutical price hikes in the CPI are not as big as in the Producer Price Index. Prices for many health goods and services actually dropped.

However, over the last twelve months, medical prices faced by consumers have grown much faster than non-health prices: 3.0 percent versus 1. percent. Prescription prices increased 4.0 percent, as did prices for inpatient hospital services. Health insurance increased 5.8 percent.

(See Table I below the fold.)

CPI: Health Insurance Premiums Jump Amid General Deflation

BLSThis morning’s Consumer Price Index corroborates yesterday’s Producer Price Index, which indicated health insurance and certain other health prices increased in a generally deflationary environment. While the CPI for all items dropped 0.2 percent in February, health insurance increased 1.3 percent. Over the last twelve months, CPI has increased just 1.0 percent, while health insurance has increased 6.0 percent.

Prescription drugs continue to stand out, as well, having increased 0.9 percent last month and 3.4 percent over twelve months. However, the increase in prescription prices alone cannot explain the health insurance premium hikes.

Inpatient hospitals services also stand out, having increased 0.6 percent last month and 4.8 percent in the last twelve months. Outpatient services are only slightly better.

February’s CPI confirms that, while nominal increases in health prices are moderate, real price increases are quite high, because we are in a generally deflationary environment.

(See Table I below the fold.)