More Accurate Measures Suggest Declining Income Inequality
Like quality health care, income inequality is a slippery concept. In both cases, the official metrics have serious problems. They often tell a different story than measures that are more carefully constructed.
In the U.S., for example, Cebula and Feige estimate that 18 to 23 percent of U.S. income is not reported to the IRS. Under-reporting appears to increase with federal tax rates, unemployment, and general dissatisfaction with government. Hurst et al. estimate that the self-employed under-report their income in the national surveys used to produce the official statistics by 25 percent.
 Many people believe that focusing on income inequality is less important than focusing on whether an economy produces social mobility by enriching people who work hard, have talent, or both. In economies like that, both the rich and the poor enjoy rising incomes over time. Maxim Pinkovskiy and Xavier Sala-i-Martin produced estimates of the distribution of world incomes in a National Bureau of Economic Research Working Paper. Their estimates for the United States, reproduced in the figure above, show that although the distance between the lower and upper ends of the income distribution has increased, incomes of both the rich and the poor have risen over the last 5 decades (The left axis is thousands of people. The x-axis is on a log scale. Dollar amounts are in constant 2000 international dollars.)
As is almost always the case when official data are used, these income distribution estimates reflect survey reports of household money income. They ignore taxes. They also ignore the benefits from in-kind assistance such as SNAP (food stamps), Medicaid, and public housing.
In a world in which income is under-reported, an estimated 63 percent of 2011 federal outlays were for payments for individuals, and the Tax Foundation estimates that 60 percent of households now receive more in transfer income than they pay in taxes, consumption measures are a more informative measure of inequality than official pre-tax money income statistics.
Meyer and Sullivan used the Consumer Expenditure Survey to provide some basic estimates of the ratio of consumption expenditures for the 90th and the 10th percentile of the U.S. income distribution.

As the second figure shows, they find that the ratio of pre-tax official money income between the 90th percentile and 10th percentile (the blue line with circles) has risen from almost 9.5 to 1 in the mid-1970s to roughly 11 to 1 in 2007. Measuring resources at the family level rather than at the household level and adjusting for differences in family size and composition (the pink line with squares) reduces the inequality ratio but shows a similar pattern of increase over time with the exception of the steeper increase in the late 1970s and early 1980s.
This picture changes dramatically when taxes (the purple line with triangles) and noncash benefits (the green line with diamonds) are taken into account. Those estimates suggest that the rise in inequality has been minimal since 1983, and that the 90/10 income inequality ratio has fluctuated between 5.5 and 6.0 since 1987.
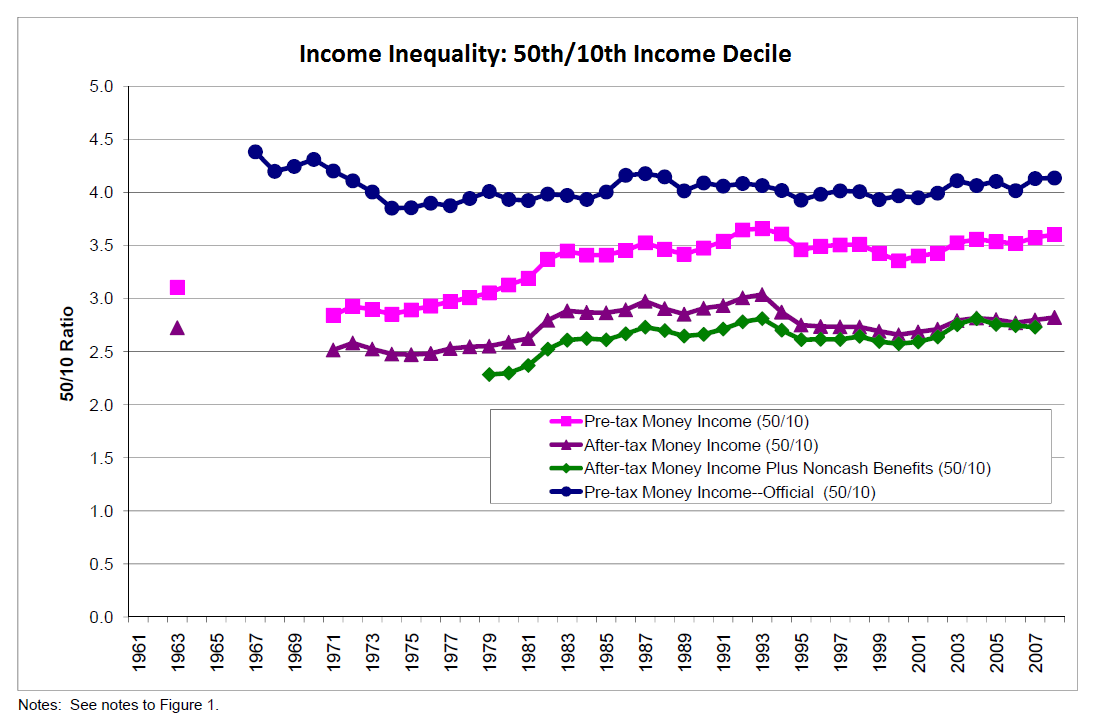
If income inequality is instead measured as the differenc e between the incomes of the bottom decile and the midpoint of the distribution, the 50/10 ratio shown in the third figure, all measures suggest relatively stable to declining income inequality since 1983.
Finally, if income inequality is measured by the differences in consumption that income transfers are designed to raise, inequality has steadily declined since the early 1980s both for the 90/10 ratio (the fourth figure) and the 50/10 ratio (not shown).
As a policy matter, these estimates suggest that growing income inequality is a far less pressing matter than the malign effects that the explosive growth in federal regulation and spending are likely to have on private sector mobility, wealth creation, and the growth in the off-the-books economy in the U.S.


The construction of the index allows room for discussion. As the post claims there are several factors that affect how we perceive this statistics. Because there are several ways this statistic can be manipulated and interpreted, the conclusions we can get from them are highly relative.
Considering the first graph. Income distribution has widened in the last few years, but the mean has increased significantly. The rich are getting richer and the poor are getting poorer, but in general Americans are doing better. In a capitalist economy like ours, this should be a positive sign that we are doing better.
The shift of the mean to the right shows that Americans are generally doing better. And if non-cash benefits are to be taken into account, income distribution is not as off as previously reported.
Consumption inequality has decreased during the period in which the liberal media claimed that income inequality was increasing significantly. This means that even earning significantly more, the difference in consumption is minimal. This doesn’t paint the grave picture that has been sold to us.
The difference in consumption is not meaningful, but there are many other things in which people spend that are not included in this comparison. Savings for example is a big one. Rich are only consuming three times as much as poor, but how much money are they savings. Discrepancies in savings will mean that in the future the gap will be significantly greater. Also the data is not considering entertainment and other things that actually widen this gap.
The liberal media always likes to paint a more grim outlook than what there really is. Since consumption hasn’t changed much, are people worse off?
Remember that individuals can either consume or invest (save), if there is no substantial difference between consumption, we might infer that the remaining is going in the form of investing. This means that those in the lower percentile are consuming all they earn in their basic needs, while those in the top are consuming what they need (three times as much) and we can suspect that the remainder is being saved. In the future the ones in the top will have more to consume while those in the lower percentile will not produce enough to consume their basic needs.
Inequality is relative concept and is very hard to explain. It is a sensitive issue with lots of political interests involved. I think that we should compare means, that way we are comparing how America has changed in average.
It is one of the bigger talking points for most politicians. While comparing how America has changed on average is one way to look at the data, it is important to see how much of the population is on each side of the distribution.
Bu only looking how America is doing on average, you are also assuming wage distribution among the population doesn’t skew one way or another.
The statistic we should look to is the one that states that around 20 percent of income is not being reported to the IRS. I believe this should be concerning, as it might shift significantly all curves. Not only the government is not receiving all its revenue, but that means that there are free riders who are taking advantage of what tax payers pay for.
But how would income inequality look then? People tend to under-report or not report at all their earnings based on dissatisfaction with taxes or their government. Once they pay more out, does income inequality grow?
It depends. Those with higher income are the lucrative targets of the IRS, thus any mistakes made by them will be subject to hefty fines. Because of this we can assume that individuals with higher income will not consistently underreport their earnings. In contrast those with lower incomes are not reporting because they don’t have enough incentives to report them or don’t have the means to do so. For that reason I believe that the underreporting is mainly of those with lower income. The additional information will shift the bell curve left, decreasing the mean and in consequence increasing inequality.
The rich put their money off-shore in the billions and did not report it. What did Uncle Sam do. Gave them a tax holiday to bring that money home.
I could use a tax holiday, or a TARP, or a QE1, 2 & 3.
Erik, not exactly a tax holiday as to agree not to criminally prosecute the fed took 40% of gross value of account (which may be more than any income).
Really, we are talking about changes in income inequality, so for under reported income to matter would need to be talking about an increase (or decrease) in under reported income. Maybe, but as a tax lawyer I think changes in the tax law relating to calculation of income dwarf any change in under reported income.
You are presenting a very compelling argument that will leave many liberals without a political platform. The problem is, as you claim, that the concept of inequality is a slippery concept, one that is highly influenced by the perspective it’s analyzed.
“Many people believe that focusing on income inequality is less important than focusing on whether an economy produces social mobility by enriching people who work hard, have talent, or both. In economies like that, both the rich and the poor enjoy rising incomes over time.” I agree with this point even though I am not a member of “money men”. As a social scientist, I show more interest in “artificial inequality” not in “institutional inequality”. Social mobility is an important estimator of inequality. Many studies have demonstrated that vertical social mobility in the U.S. is not becoming worse. (Please see Prof. Xie, 2013)
As a tax lawyer, I think there are 2 things I have never seen discussed regarding income inequality. The first is a meaningful change in the tax laws in 1986 which largely eliminated tax shelters and the preference to hold private businesses in corporate form. Before 1986, a high income individual would use tax shelters to reduce his income to an acceptable level, and if a business owner he would operate his business through a corporation so the income never showed up on his return. Many of these changes were phased in, so would take effect only over time ( if you doubt the importance of these changes, look at tax data and changes in relative share of AGI among groups, there has been no change since 1998, once these changes were in place).
The second is that the individuals in the top 1% are not the same from one year to the next. To get a meaningful view of changing income inequality, to have to take a longer term view as in a world of commissions, bonuses, defined contribution ( versus defined benefit ) pensions, low interest rates and low stock market returns, it would be surprising if there were not more movement in and out of the different income groups than before.