Search Results for 'construction'

Health Construction Declined in January, Robust Year on Year

Census2The construction market was weak overall in January, especially in health facilities, where construction starts declined 1.6 percent from December. Other construction starts declined only 1.0 percent. Health facilities construction accounted for just under six percent of the value of all new nonresidential construction.

Construction of private health facilities dropped 0.2 percent, versus an increase of 0.3 percent for private non-health facilities. Private health facilities construction starts accounted for over seven percent of private nonresidential construction starts. Construction of public health facilities dropped by 6.6 percent. However, construction of other public facilities dropped by 4.9 percent. In other words, the decline in health facilities construction was 0.4 percentage points worse than the change in non-health private construction, versus 1.7 percentage points worse than non-health public construction (Table I).

Health Construction Picked Up in December

Census2Health facilities construction turned around in December, growing 0.6 percent versus a decline of 0.3 percent in starts for other construction. Health facilities construction accounted for almost 6 percent of non-residential construction starts. However, the growth was all in private health facilities.

Construction of private health facilities grew 1.2 percent, versus an increase of 0.2 percent for private non-health facilities. Private health facilities construction starts accounted for less than 4 percent of private nonresidential construction starts. Construction of public health facilities dropped by 1.5 percent. However, construction of other public facilities dropped by even more, 1.8 percent. In other words, health facilities construction outpaced non-health construction by 1.0 percentage points in the private construction market, versus only 0.3 percentage points in the public construction market (Table I).

Drop in Health Facilities Construction Continues in November

Census2October’s construction trend continued in November. Overall, health facilities construction starts declined 0.1 percent, versus an increase of 0.9 percent for other construction. Health facilities construction accounted for almost 6 percent of non-residential construction starts. However, there was greater gap between health and non-health starts in private than public construction.

Construction of private health facilities dropped 0.2 percent, versus an increase of 1.0 percent for private non-health facilities. Private health facilities construction starts accounted for less than 4 percent of private nonresidential construction starts. Construction of public health facilities increased by 0.4 percent, while construction of public non-health facilities increased 0.8 percent. In other words, non-health facilities construction outpaced health construction by 1.2 percentage points in the private construction market, versus only 0.4 percentage points in the public construction market.

For the twelve months ending last October, there was a significant difference in trend between private and public construction. Non-health private construction increased 4.3 percent, but private health facilities construction dropped 1.5 percent. On the other hand, non-health facilities public construction increased 2.6 percent, while public health facilities construction increased by 2.9 percent.

This suggests private investors are nervous about future revenue growth in hospitals and other facilities.

See Table I below the fold:

Significant Drop in Health Facilities Construction in October

Census2Construction of health facilities slowed in October, while other construction increased a little. Overall, health facilities construction starts declined 3.1 percent, versus an increase of 0.7 percent for other construction. Health facilities construction accounted for almost 6 percent of non-residential construction starts. However, while both private and public health facilities construction both declined, there was divergence between private and public non-health construction.

Construction of private health facilities dropped 3.3 percent, versus a drop of 2.1 percent for public health facilities. Private health facilities construction starts accounted for almost 8 percent of private nonresidential construction starts. Construction of private non-health facilities declined by 2.0 percent, while construction of public non-health facilities increased 2.9 percent. It looks like the government has finally pulled back spending on public and VA hospitals.

(See Table I below the fold.)

Divergence in Private Versus Public Health Facilities Construction Continues in September

Census2Construction of health facilities slowed in September, along with other construction. Overall, health facilities construction starts declined 0.3 percent in September, versus a drop of 0.4 percent for other construction. Health facilities construction accounted for 6 percent of non-residential construction starts. However, the divergence between private and public continued.

Construction of private health facilities dropped 1.0 percent, versus a drop of 0.2 percent for other private construction. Private health facilities construction starts accounted for almost 8 percent of private nonresidential construction starts. Construction of public health facilities increased a whopping 2.4 percent, versus a drop of 1.0 percent for other public construction. Is this what they mean by “infrastructure” spending – broken bridges and roads, while more VA and county hospitals spring up?

(See Table I below the fold.)

Health Facilities Construction Growth Up Amidst General Decline in August

Census2Construction of health facilities significantly outpaced other construction in August. Overall, health facilities construction starts increased 1.2 percent in August, versus a drop of 0.8 percent for other construction. Further, both private and public health facilities construction grew.

Construction of private health facilities grew 0.6 percent, versus a drop of 0.4 percent for other private construction. Construction of public health facilities increased a whopping 3.6 percent, versus a drop of 2.2 percent for other public construction. Is this what they mean by “infrastructure” spending – broken bridges and roads, while more VA and county hospitals spring up?

See Table I Below the fold:

Significant Divergence in Private Vs. Public Health Facilities Construction in July

Census2The divergence between private and public health facilities construction continued in July. Overall, health facilities construction starts increased 0.3 percent in July, versus zero for other construction. However, there was a significant difference between the private and public segments.

Construction of private health facilities dropped 0.3 percent, versus an increase of 1.0 percent for other private construction. Construction of public health facilities increased a whopping 2.5 percent, versus a drop of 3.2 percent for other public construction (Table I).

Is this what they mean by “infrastructure” spending – broken bridges and roads, while more VA and county hospitals spring up?

Health Construction Shrinks Twice As Fast As Other Construction in June

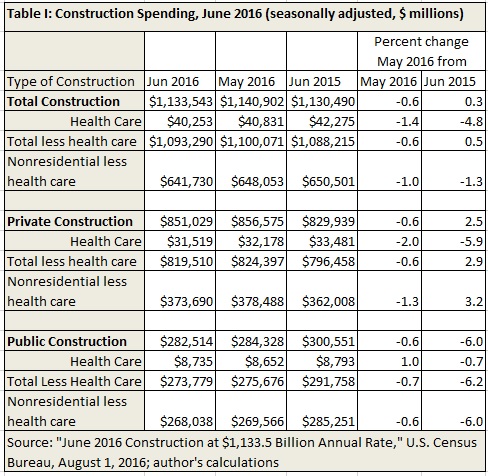
Census2The see-saw in health facilities construction continues. Health construction starts dropped 1.4 percent in June, versus a drop of 0.6 percent for other construction (Table I). However, there was a significant difference between the private and public segments.

TI

Health Facilities Exceed Other Construction in May

Census2April’s drop in health facilities starts looks to have been idiosyncratic. Health facilities exceeded other construction in May, as in March and February. While construction overall dropped at a seasonally adjusted annual rate of 0.8 percent, health construction increased 0.2 percent (See Table I below the fold).

The difference was especially apparent in private construction. Construction of private health facilities increased 0.5 percent, 0.8 percentage points more than other private construction, which declined.  Construction of public health facilities dropped 1.0 percent, but this was less than half the drop in other public construction.

For the twelve months from May 2015, there is a significant difference in trend between private and public construction. Private construction increased 4.7 percent, and private health facilities starts increased at almost exactly the same rate. However, while public construction declined 2.6 percent, public construction of health facilities dropped only 1.4 percent.

Overall, health construction increased 3.3 percent, versus only 2.8 percent for non-health construction. Notwithstanding other factors, this indicates health costs will continue to increase faster than other sectors of the economy because (as the old saying goes) “a bed built is a bed filled.”

Health Construction Boomlet Collapses in April

Census2The boomlet in health construction from February and March lost its wind in April. While construction overall dropped at a seasonally adjusted annual rate of 1.8 percent, health construction dropped by 3.0 percent (See Table I below the fold).

The drop was much greater for private than public health facilities, especially relative to other construction. Construction of private health facilities dropped 3.6 percent, 2.2 percentage points more than the decline in other private construction.  Construction of public health facilities dropped 0.8 percent, 2.1 percentage points less than the decline in other public facilities.

This turnaround after a two-month boomlet puts health construction back on the longer term trend. For the twelve months from April 2015, construction of non-health facilities boomed 4.7 percent versus a decline of 0.6 percent for health facilities. Notwithstanding other factors, this is welcome because it indicates a shift from inpatient to outpatient care at lower cost.