Tag: "Hospitals"

Health Insurers, Hospitals Cannot Figure Out How To Pay For Catastrophic Care

Physician and Nurse Pushing GurneyAn advocate of consumer-driven health care, who makes the case that individuals should control most of our health spending directly, will not get very far before hearing the rebuttal: “When you have a heart attack or get hit by a bus, you won’t be in any condition to negotiate which hospital you go to.”

Fair enough, which is why we advocate insurance for catastrophic events, just like for houses or automobiles. However, in the current system, insurers and hospitals are dropping the ball on even that:

Read More » »

CPI: Medical Prices Resume Upward March

BLSDue to vacation, I did not discuss June’s release of the Consumer Price Index for May, in which medical care prices were very moderate. This continued that which was observed in May (for the April CPI).

Unfortunately, prices for medical care resumed their upward march in the June CPI, released today. At 0.4 percent, prices for medical care increased twice as fast as the CPI for all items. Price changes for medical care contributed 16 percent of the price change for all items. Prescription drug prices, especially, resumed their increase. Prices for medical care services, on the other hand, were in line with the CPI for all items.

Over the last twelve months, prices for medical care have increased over four times faster than prices for all items other than medical care. Medical care price increases have contributed almost one third (29 percent) to the price increase of one percent for all items. Claims that consumers have experienced relief from medical prices are simply not grounded in data.

(See Table I below the fold.)

Read More » »

Health Facilities Exceed Other Construction in May

Census2April’s drop in health facilities starts looks to have been idiosyncratic. Health facilities exceeded other construction in May, as in March and February. While construction overall dropped at a seasonally adjusted annual rate of 0.8 percent, health construction increased 0.2 percent (See Table I below the fold).

The difference was especially apparent in private construction. Construction of private health facilities increased 0.5 percent, 0.8 percentage points more than other private construction, which declined.  Construction of public health facilities dropped 1.0 percent, but this was less than half the drop in other public construction.

For the twelve months from May 2015, there is a significant difference in trend between private and public construction. Private construction increased 4.7 percent, and private health facilities starts increased at almost exactly the same rate. However, while public construction declined 2.6 percent, public construction of health facilities dropped only 1.4 percent.

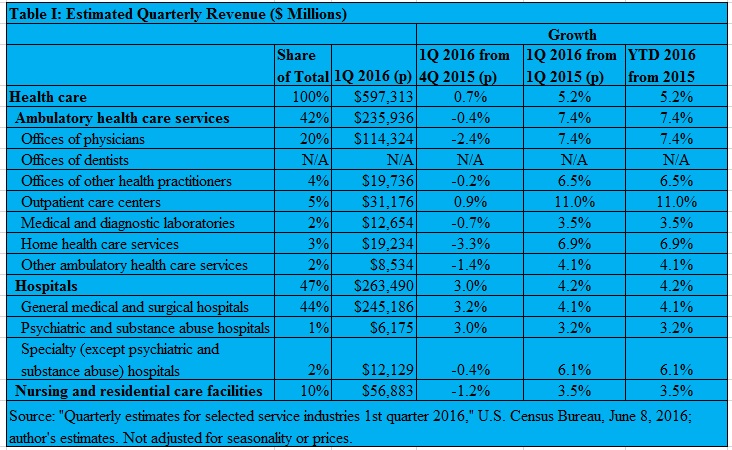
Overall, health construction increased 3.3 percent, versus only 2.8 percent for non-health construction. Notwithstanding other factors, this indicates health costs will continue to increase faster than other sectors of the economy because (as the old saying goes) “a bed built is a bed filled.”

Read More » »

QSS: Strong But Inconsistent Health Services Revenue Growth

Census2This morning’s Quarterly Services Survey from the Census Department showed good growth in revenues for health services, but it was inconsistent within the industry. Overall, first quarter revenue grew 0.7 percent from the fourth quarter and 5.2 percent from the first quarter of 2015 (Table I).

20160608 TIA

Read More » »

Health Construction Boomlet Collapses in April

Census2The boomlet in health construction from February and March lost its wind in April. While construction overall dropped at a seasonally adjusted annual rate of 1.8 percent, health construction dropped by 3.0 percent (See Table I below the fold).

The drop was much greater for private than public health facilities, especially relative to other construction. Construction of private health facilities dropped 3.6 percent, 2.2 percentage points more than the decline in other private construction.  Construction of public health facilities dropped 0.8 percent, 2.1 percentage points less than the decline in other public facilities.

This turnaround after a two-month boomlet puts health construction back on the longer term trend. For the twelve months from April 2015, construction of non-health facilities boomed 4.7 percent versus a decline of 0.6 percent for health facilities. Notwithstanding other factors, this is welcome because it indicates a shift from inpatient to outpatient care at lower cost.

Read More » »

Will You Ever Understand Your Medical Bill?

stress(A version of this Health Alert was published by Forbes.)

It is hard to exaggerate how painful the medical billing process is for patients. Steven Brill, an entrepreneurial lawyer turned journalist, became one of the most famous critics of American health care when Time magazine published a long article by him in 2013. It was a wide ranging criticism of pretty much everything in U.S. health care, which grabs and keeps our attention because it uses the absurd hospital bill as the fulcrum for his case:

The first of the 344 lines printed out across eight pages of his hospital bill — filled with indecipherable numerical codes and acronyms — seemed innocuous. But it set the tone for all that followed. It read, “1 ACETAMINOPHE TABS 325 MG.” The charge was only $1.50, but it was for a generic version of a Tylenol pill. You can buy 100 of them on Amazon for $1.49 even without a hospital’s purchasing power. Dozens of midpriced items were embedded with similarly aggressive markups, like $283.00 for a “CHEST, PA AND LAT 71020.” That’s a simple chest X-ray, for which MD Anderson is routinely paid $20.44 when it treats a patient on Medicare, the government health care program for the elderly.

(Steve Brill, “Bitter Pill: Why Medical Bills Are Killing Us,” Time, February 20, 2013)

It is hard not to get carried away on a wave of outrage when reading stories of patients faced with ridiculous bills, which (even if they can understand them) they might never be prepared to pay. A new crop of entrepreneurs is hoping to solve this problem.

Read More » »

CPI: Medical Inflation Finally Under Control

BLSThe Consumer Price Index (CPI) for April confirmed medical inflation is matching the broad measure of price changes. For the second month, price changes for medical care (0.3 percent) were in line with all-items (0.4 percent). Although, it looks like a jump in energy prices drove the CPI up. If energy price increases moderate, we can expect prices for medical care to increase faster than CPI.

With respect to medical commodities, it prices of prescription drugs continued to increase faster than other medical commodities or commodities over all. Although, pharmaceutical price hikes in the CPI are not as big as in the Producer Price Index. Prices for many health goods and services actually dropped.

However, over the last twelve months, medical prices faced by consumers have grown much faster than non-health prices: 3.0 percent versus 1. percent. Prescription prices increased 4.0 percent, as did prices for inpatient hospital services. Health insurance increased 5.8 percent.

(See Table I below the fold.)

Read More » »

Health Jobs Grow More Than Three Times Faster Than Other Jobs

BLSHealth services jobs grew over three times faster than non-health, nonfarm civilian jobs in April. Health services jobs comprised 44,200 (28 percent) of 160,000 jobs added. The rate of growth from March was 0.29 percent for health services jobs versus only 0.09 percent for other jobs (Table I).

20160506 TI

Read More » »

Health Construction Boomlet Continues

Census2The boomlet in health construction, first noted in last month’s Census Bureau release, continued in March. Health facilities construction starts grew 1.6 percent, while other construction grew only 0.3 percent (Table I).

The rate of growth was significantly greater for public health facilities (2.3 percent) than private health facilities (1.4 percent). Further, the relative growth was much larger for public health facilities, because non-health public construction declined by 2 percent, while non-health private construction grew 0.7 percent.

This is the second month of uptick in health facilities construction. Over the last twelve months, health facilities construction starts have grown only half as fast as non-health starts (4.1 percent versus 8.2 percent). It is too early to say whether the boomlet in health facilities construction indicates a trending upturn. However, it suggests health systems are beginning to be optimistic about their abilities to continue to extract revenue from the system.

Read More » »

CPI: Most Medical Price Hikes Stall

BLSThe Consumer Price Index for March indicates that medical price inflation matched changes in other prices charged to consumers, with a slight uptick of 0.1 percent. Prescription drugs (0.5 percent increase), nursing homes and adult day care, eyeglasses, and health insurance (all with 0.4 percent increases) stood out as continuing to experience higher inflation than other items. Prices for many health goods and services actually dropped.

However, over the last twelve months, medical prices faced by consumers have grown much faster than non-health prices: 3.3 percent versus 0.6 percent. Prescription prices increased 3.4 percent. However, inpatient hospital services and health insurance prices increased much faster, by 5.9 percent and 6.0 percent.

When we compare the medical components of the CPI with those in the Producer Price Index, it appears that hospitals, not drug makers, are shifting more prices directly onto consumers.

(See Table I Below the fold.)

Read More » »