Tag: "Health Care Costs"

CPI: Medical Care Prices Rose 10 Times More Than Non-Medical Prices in August

BLSThe Consumer Price Index rose 0.2 percent in August. Medical prices, however, continued their upward march, increasing by one full percent – 10 times more than non-medical consumer goods and services. If prices for medical care had been flat, the CPI would have risen by just 0.1 percent. Hospital services, prescription drugs, and health insurance stand out even within medical care. Price increases for medical care have contributed 42 percent of the overall CPI increase.

Over the last twelve months, prices for medical care have increased seven times faster than prices for non-medical items in the CPI. Price increases for medical care have contributed 36 percent of the overall CPI increase.

Many observers of medical prices decline to differentiate between nominal and real inflation. Because CPI is flat, even relatively moderate nominal price hikes for medical care are actually substantial real price hikes. More than six years after the Affordable Care Act was passed, consumers are seeing no relief from high medical prices, which have increased over twice as much as the CPI less medical care since March 2010, the month President Obama signed the law.

(See Figure I and Table I below the fold):
Read More » »

Consumer Driven Health Care Gets Messy: That’s the Good News

According to a new health benefits survey by the Kaiser Family Foundation, premiums for employer coverage rose only about 3% in 2016. The low increase was due to rising deductibles. A slight majority (51%) of workers have a deductible of $1,000 or more. Two-thirds of workers in small firms do, while slightly less than half of large firm workers (45%) are covered by $1,000 or higher deductible.  About 10 years ago, only 4% of workers were enrolled in a high-deductible plan with a savings component. Now, nearly one-third are. [See the figure.]

Read More » »

PPI: Health Prices Up Among Zero Overall Inflation

BLSAs with July’s Producer Price Index, health price inflation is no longer eye-popping, but still higher than overall PPI, which was flat in August. Hospital outpatient care stands out, with prices having risen 1.1 percent, monthly. Other price increases were moderate, but only prices of X-Ray machines and electromedical equipment declined.

This is also true over the last twelve months. Pharmaceutical prices especially stand out, even though they have risen moderately for a few months. It will take a while for the trend of high prices hikes from a few months ago to break down. Nursing homes, for which prices rose 3.0 percent, might replace drug makers as the whipping boy for high health prices, but they have a long way to go.

(See Table I below the fold.)

Read More » »

EpiPen:  A Case Study In Health Insurance Failure

I recently wrote a post describing EpiPen as a “Case Study in Government Harm,” describing how the government had made it possible for the manufacturer to increase prices of the life-saving drug multiple times without fear of retaliation. It is also a case study in how health insurance distorts our choices and increases their cost. I learned this by following an Internet advertisement for EpiPen down its rabbit hole.

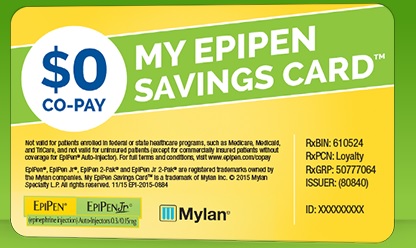
The ad induced me to download my “EpiPen Savings Card” which would ensure I paid nothing for my EpiPens (up to six, according to the ad):

epipen-1

However, I had to answer a skill testing question first: What was my insurance coverage? As you can see from the screenshot below, when I answered I had no insurance, the EpiPen savings card was figuratively ripped from my hand:

Read More » »

Do Transparency Tools Work in Health Care?

Laptop and Stethoscope --- Image by © Royalty-Free/Corbis

Laptop and Stethoscope — Image by © Royalty-Free/Corbis

A new report by economist Jon Gabel and his colleagues at NORC, a research center affiliated with the University of Chicago, looked at the use of transparency tools in an employer health plan. The analysis found the use of price transparency tools to be spotty. For instance, 75 percent of households either did not log into the transparency tool or did so only one time in the 18-month period of study. Fifteen percent did so twice; but only 1 percent logged in 6 times or more. The study concluded:

It could very well be that we are asking too much of a single tool, no matter how well-designed. Consumer information for other goods and services on price and quality are seldom dependent upon information gained mainly, if not solely, through a digital tool. Rather, information on relative value is spread far and wide through advertising and other kinds of promotion using conventional, digital, and social media communication channels.

Read More » »

QSS: Strong Health Services Revenue Growth in 2nd Quarter

Census2This morning’s Quarterly Services Survey showed strong revenue growth in health services. Overall, revenues grew 3.6 percent in Q2 versus Q1 and 6.7 percent versus Q2 2015. For the first half, revenues grew 5.9 percent versus H1 2015. Growth was positive in all sectors except specialty hospitals. Physicians’ offices led the growth, at 4.5 percent. This is a turnaround from Q1. Perhaps most surprising was medical and diagnostic labs, for which revenue grew 4.0 percent. Labs have shed jobs, so increasing revenue suggests productivity improvements.

See Table I below the fold:

Read More » »

GDP: Health Services Grow Over Five Times Faster Than “Sluggish” Non-Health GDP

BEAToday’s second estimate of second quarter Gross Domestic Product confirms spending on health services is dramatically outpacing other “sluggish” GDP growth. Fixed investment, durable goods, and inventories continued to collapse, while imports increased. Therefore, growth in services spending grew much faster than GDP. In real (inflation-adjusted) dollars, services grew 4.3 percent (annualized, seasonally adjusted). As a large component of services, health services grew 3.8 percent.  While real GDP growth was 1.1 percent, once health services is stripped out, non-health GDP grew just 0.7 percent (Table I).

(See Table I below the fold.)

Read More » »

The “Right to Shop” For Health Care

credit-card-2Anyone who has undergone a medical procedure knows it is very difficult to figure out how much an insured patient will pay out-of-pocket. It is often not clarified for months after the procedure, after a flurry of incomprehensible paperwork from insurers, doctors, labs, et cetera, has landed in the patient’s mailbox.

(Personal aside: A couple of years ago, my health insurer encouraged me to go paperless, and I signed up for electronic messages about claims. It was so confusing, I went back to paper after a few months. At least you can scrunch up a letter and throw it across the room with an anguished scream, which you don’t want to do with your computer.)

This problem has led to a bunch of state laws attempting to impose “price transparency” on medical providers. As discussed previously, they do not work, because relationships between insurers and providers inhibit transparency. Medical providers “customers” are insurers, which pay most of their claims, not patients. Further, the real problem with medical prices is not that they are opaque, but that they are not formed in a normal market process. Instead, they are negotiated by third-party bureaucracies.

Read More » »

CPI: Medical Prices Continue Upward March

BLSThe Consumer Price Index for July was flat. Medical prices, however, continued their upward march, increasing by one half of one percentage point. If prices for medical care had been flat, the CPI would have declined by 0.1 percent. Prescription drugs, physicians’ and other medical professionals’ services, and health insurance stand out even within medical care.

Over the last twelve months, prices for medical care have increased almost seven times faster than prices for non-medical items in the CPI. Price increases for medical care have contributed 40 percent of the overall CPI increase.

Many observers of medical prices decline to differentiate between nominal and real inflation. Because CPI is flat, even relatively moderate nominal price hikes for medical care are actually substantial real price hikes. Consumers are seeing no relief from high medical prices.

Read More » »

PPI: Health Price Inflation Low, But Not Low Enough

BLSThis morning’s Producer Price Index came in unexpectedly low, decreasing 0.4 percent versus an expected slight increase of 0.1 percent. Except for nursing home care, which increased 0.9 percent, producer prices for medical goods and services decreased or increased very modestly. Of 15 medical goods and services measured in the PPI, four actually experienced price decreases over the month. This number includes pharmaceutical preparations. However, because overall PPI actually deflated significantly, all medical prices increased at a faster rate than the overall PPI.

Over the last twelve months, prices for all but one medical category (medical lab and diagnostic imaging services) have increased faster than overall PPI. At 6.3 percent (versus just 0.3 percent for final demand), producer prices for pharmaceutical preparations stand out. However, the monthly PPI suggests this trend might be breaking down. Nursing homes, for which producer prices increased 2.5 percent might replace drug makers as a target of politicians’ campaigns against health costs, but they have a long way to go.

(See Table I below the fold.)

Read More » »