Tag: "Health Care Costs"

Consumer Price Index: Amid Disinflation, Medical Prices Increasing

BLSYesterday’s Consumer Price Index (CPI) release confirmed prices of medical goods and services continue to rise at a steady pace, despite the general deflationary environment. The CPI declined 0.1 percent from July to August (seasonally adjusted), and increased just 0.2 percent in the last twelve months.

Much of the disinflation is caused by dropping energy prices. Excluding food and energy, the CPI increased 0.1 percent last month and 1.8 percent over the last twelve months. Medical care, although flat last month, increased 2.5 percent over the last twelve months (see Table I). This is moderate by historical standards, but still excessive relative to current CPI.

Read More » »

Why Is There No Car Care Crisis?

employer coverage 300(A version of this Health Alert was published by RealClearPolicy.)

Our health care is in “crisis.” We seem to have achieved the remarkable result of spending too much money while not ensuring access for enough people. Every politician says so, and most citizens agree. Indeed, no presidential candidate can be viewed as credible without proposing a health reform “plan.”

Hillary Clinton has sworn to protect and uphold the Affordable Care Act against all right-wing conspirators; Bernie Sanders has long advocated a government-monopoly, single-payer system; and Republican contenders will continue to roll out plans to “repeal and replace Obamacare” that will immediately come under attack by conservatives and libertarians as “Obamacare-lite.”

Let’s put the crisis in perspective. According to actuaries at the federal government, spending on health care per person in 2014 was $9,176. Yet according to the American Automobile Association (AAA), the average cost of operating and maintaining an average sedan in 2014 was $8,876 — almost exactly the same as health spending. Of course, not everyone owns a car, but most of us do. According to IHS Automotive, an industry research firm, 253 million cars traveled America’s roads last year. According to the Census Bureau, there were 239 million of us aged 18 through 84; that’s slightly more than one car per person in prime driving years.

Read More » »

PPI: Gap in Hospital Inpatient & Outpatient Prices

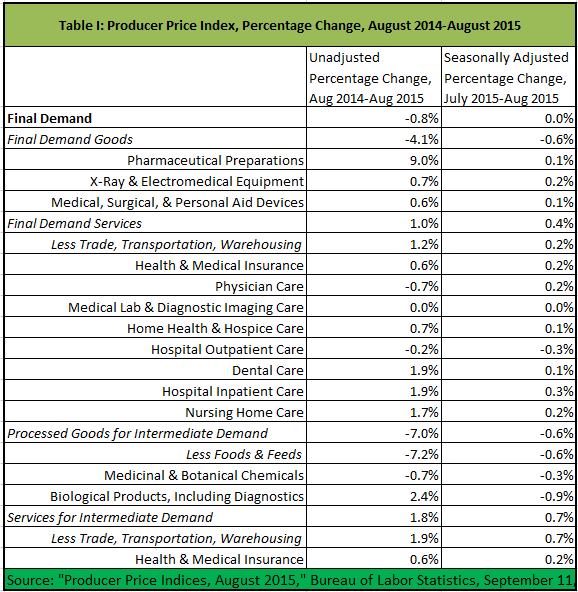
BLSAugust’s Producer Price Index was flat, month on month, and dropped 0.8 percent, year on year, continuing the trend we saw last month. Producer prices for health goods and services are rising faster than other producer prices (see Table I).

20150911 TI

Read More » »

Hospital Margins Up 9 Percent

This morning’s Quarterly Services Survey (QSS), published by the Census Bureau, reported that:

The estimate of U.S. health care and social assistance revenue for the second quarter of 2015, not adjusted for seasonal variation, or price changes, was $591.3 billion, an increase of 2.2 percent (± 0.8%) from the first quarter of 2015 and up 6.4 percent (± 1.3%) from the second quarter of 2014. The fourth quarter of 2014 to first quarter of 2015 percent change was revised from -0.4 percent (± 1.1%) to -0.5 percent (± 1.1%).

The QSS adds important information to the more widely reported quarterly Gross Domestic Product (GDP) and Employment Situation Summary (ESS) releases that I frequently discuss on the blog.

Read More » »

A Welcome Break – Moderate Health Spending Growth in Q2 GDP

Last week’s second estimate of Gross Domestic Product for the second quarter confirms that growth in health spending took a welcome break. Unfortunately, it is not a clear break in the trend of health spending consuming an increasing share of our national income.

When we compare 2015 Q2 to 2014 Q2 annualized spending, health care is still consuming a slightly disproportionate share of GDP. Health spending grew $106 billion, comprising 17 percent of the $632 billion change in GDP. GDP only grew 3.66 percent, while health spending grew 5.47 percent.

Read More » »

Health-Related Producer Prices Tame in July

BLSThe Producer Price Index (PPI) for July increased more than expected, but was still benign. Health-related producer prices were tame last month.

Prices for pharmaceutical preparations, which have increased faster than other producer goods in the long term (rising 9.4 percent since July 2014), finally turned around and actually dropped 0.4 percent last month (See Table I). This was a bigger decline than prices for all final demand goods (-0.1 percent) or for all final demand (0.2 percent).

Read More » »

Producer Price Index: Pharma, Biologics Jump

The Producer Price Index (PPI) for June increased more than expected, as the effect of the drop in oil prices abated. As shown in Table I, producer price growth for health goods and services was in line with tame growth in overall PPI, which grew 0.4 percent on the month and dropped 0.7 percent on the year to June.

The exceptions were pharmaceutical preparations, which increased 2.5 percent on the month and are up 10.3 percent on the year; and biologic products (including diagnostics), which increased 3.1 percent month on month and 3.2 percent year on year.

Read More » »

Selling the Same Thing for a Different Price is Normal Market Behavior

Understanding the price of ketchup may go a long way towards explaining why mainstream health reformers give such bad reform advice.

Per capita health spending varies a great deal. It varies by geography, it varies by health status, it varies by demographics, and it varies by individual patient characteristics. Academics and government officials decry this variation. They think that health care spending and utilization should be the same everywhere. Despite ritual hand waving about the importance of clinical differences, their policy recommendations generally attribute variation to inefficiency, overuse, and waste.

Read More » »

Obamacare is Reducing Competition

Novel concepts—whether practice-management companies, home health care or the first for-profit HMO—almost always have come from entrepreneurial firms, often backed by venture capital.

That venture capital has been drying up since ObamaCare was passed. Instead, the biggest wagers in health-care services are being placed by private equity, which is chasing opportunities to roll up parts of the existing infrastructure. For instance, there were 95 hospital mergers in 2014, 98 in 2013, and 95 in 2012. Compare that with 50 mergers in 2005, and 54 in 2006. Cheap debt and ObamaCare’s regulatory framework almost guarantee more consolidation. That will mean less choice for consumers.

(Scott Gottlieb, “How the Affordable Care Act Is Reducing Competition,” Wall Street Journal, July 5, 2015.)

GDP: Health Spending 43 Percent of Increase In Personal Consumption

Where is your money going? Increasingly, the answer is health care. This morning’s third estimate of first quarter Gross Domestic Product (GDP) was not as awful as previously estimated – a real decline of 0.2 percent, not 0.7 percent.

The overall drop of $7 billion was driven by a decline in exports and nonresidential structures. Personal consumption expenditures increased by $58.3 billion. However, $48.1 billion of that was services, of which $24.2 billion was health care. Almost half the quarterly increase in personal consumption was health care.

As I have noted consistently for over a year, a distressingly large share of our national prosperity is being consumed by the government-medical complex.

Read More » »