Tag: "Health Care Costs"

PPI: Health Prices Continue to Rise Faster Than Others

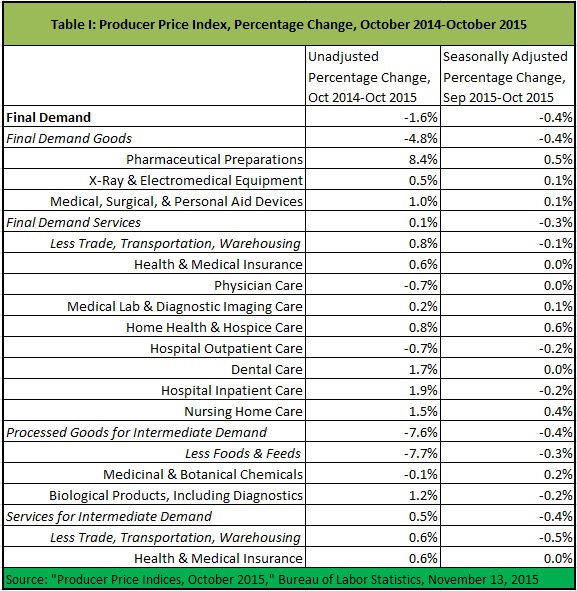
October’s Producer Price Index declined 0.4 percent, month on month, and dropped 1.6 percent, year on year. Mild deflation continues to take hold in the general economy. However, it is not so in health care. Of the 14 sub-indices for health-related goods and services, only three declined month on month. Only six declined year on year (see Table I).

20151113 PPIa

Read More » »

Hospitals’ Uninsured Patients Rising Again

Remember how Obamacare was supposed to reduce the burden of so-called “uncompensated care” from uninsured patients that was driving hospitals bankrupt? Well, two years into Obamacare it hasn’t worked out that way:

Hospital operator HCA Holdings Inc on Tuesday said more patients are coming through its doors who have lost their health insurance, most likely because they stopped paying for it.

The largest U.S. for-profit hospital chain said it admitted more uninsured patients in the third quarter who had previously registered with health insurance, compared with a year ago. They included people who bought coverage from marketplaces set up under President Barack Obama’s Affordable Care Act, but then dropped it.

“We believe this is likely due to non-payment of premiums,” HCA Chief Financial Officer Bill Rutherford said on the company’s earnings call.

Overall, the company admitted 13.6 percent more uninsured patients in the third quarter. It was the second straight quarterly increase in uninsured admissions, reversing a downward trend since the insurance exchanges opened for business in early 2014

(Susan Kelly, “HCA says some patients dropping their new insurance coverage,” Reuters. October 27, 2015.)

Protecting hospitals’ revenues by increasing the number of insured Americans was never actually a legitimately important goal of health reform, although hospitals are very successful at making that case. Now, it looks like Obamacare doesn’t even do that.

Health Services Accounts for One Fifth of Weak Q3 GDP Growth

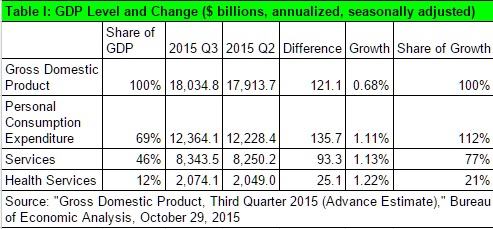
BEAToday’s advance estimate of Gross Domestic Product for the third quarter indicates growth in health spending is maintaining a disproportionate share of weak GDP growth. Commenters noted that the weak estimate was largely due to shrinking inventories. This explains why personal consumption expenditure (PCE) growth ($135.7 billion) was actually higher than GDP growth ($121.1 billion), quarter on quarter (Table I).

20151029 GDP T

Read More » »

Health Care and the Budget Deal: Three Steps Forward, One Step Back

debt

(A version of this Health Alert was published by Forbes.)

Yesterday, the White House and Congressional leaders announced a last-minute budget agreement that avoids a so-called government shut-down for now. The deal has four health-related items, and is expected to reduce net federal health spending by about $4.5 billion over five years, and $15.5 billion over ten years. Overall, it is not a bad deal with respect to health care. However, some of its budget savings are fragile and it largely avoids reforms that will actually reduce the growth of health spending.

Read More » »

The U.S. Is The Third Lowest Health Spender of 13 Developed Countries

(A version of this Health Alert was published by Forbes.)

Scholars affiliated with the Commonwealth Fund recently published another report in the Fund’s series of international comparisons of U.S. health care. These reports are always well received by the media, which run articles lamenting how expensive U.S. health care is, and how great a burden on the country. Encouraged by the Commonwealth Fund to conclude that the major difference between health care in the U.S. and other developed countries is that they have “universal” health systems, many reasonable people understandably conclude that such a reform could reduce the cost of U.S. health care.

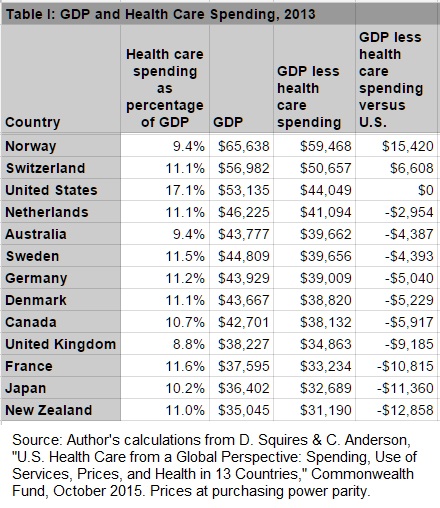
This conclusion is way off-base. According to the report, U.S. health spending accounted for 17.1 percent of Gross Domestic Product (GDP) in 2013. France comes next, at 11.6 percent. In dollar figures, the U.S. spent $9.086 per capita, versus only $6,325 in Switzerland, the runner-up. (These prices are reported at purchasing power parity, which adjusts the foreign currency exchange rates for differences in cost of living.)

These results certainly invite us to question whether we are getting our money’s worth. However, it is not clear that this spending is a burden on the U.S., given our very high incomes. Table I shows that when we subtract U.S. health spending from our Gross Domestic Product (GDP), we still had $44,049 per capita to spend on everything else we value. Only two countries, Norway and Switzerland, beat the U.S. on this measure. In the United Kingdom for example, GDP per capita after health spending was only $34,863 in 2013. So, even though American health care is significantly more expensive than British health care, the average American enjoyed $9,185 more GDP after health spending than his British peer, and just under $6,000 more than his Canadian neighbor.
20151026 Commonwealth Fund TI

Read More » »

CPI: Deflation Except In Health Care (Again)

I admitBLS this is getting a little repetitive, but it is not my fault the Bureau of Labor Statistics (BLS) releases the Consumer Price Index one day after the Producer Price Index. The CPI confirms (once again) the price behavior indicated by yesterday’s PPI.

While consumer prices were down 0.2 percent, month on month, and flat year on year, medical prices increased 0.2 percent and 2.5 percent (Table I). However, prescription drugs experienced quite moderate price increases last month. This means that while prices of medical goods and services overall increased, month on month, there was no sticker shock versus the CPI. Unfortunately, yesterday’s PPI suggests that price increases are flowing through the system again, and we can expect to see a pick-up in health prices versus overall inflation, in future CPIs.

Read More » »

PPI: Deflation Except in Health Care

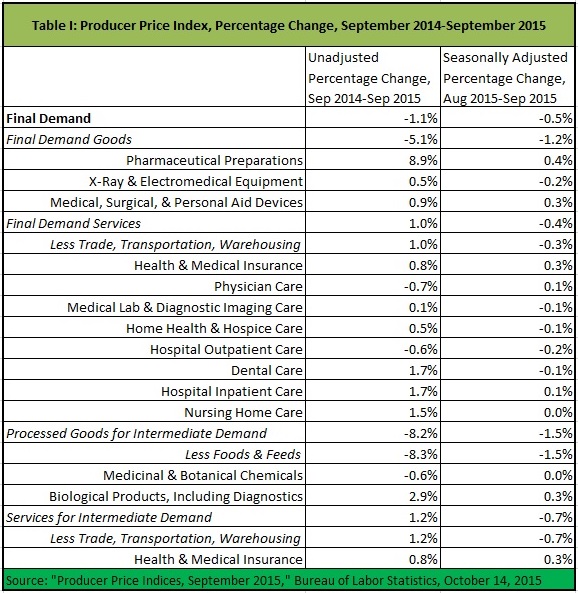
BLSSeptember’s Producer Price Index declined 0.5 percent, month on month, and dropped 1.1 percent, year on year. A mild deflation appears to be taking hold in the general economy. However, it is not so in health care. Of the 14 sub-indices for health-related goods and services, only five declined month on month. Only three declined year on year (see Table I).

20151014 PPI

Read More » »

Castlight Health: Pricing for Medical Services Is All Over The Map

CastlightCastlight Health has published its second annual U.S. Costliest Cities Analysis, which shows astonishing variation for prices of medical procedures. This year’s report focuses on women’s preventive health:

Mammogram. Nationwide for a mammogram, a woman could pay anywhere from $43 to $1,898 for the test, a 44x difference. With some of the country’s largest cities, the clear indication is that women in larger metropolitan areas are being charged wildly varying amounts for a critical preventative test. For example:

  • In Dallas, which has the nation’s widest range, a woman could pay anywhere from $50 to $1045, roughly a 21x difference.
  • In New York City, the price can vary between $130 to $1,898, roughly a 15x difference. New York also has the most expensive mammograms in the entire country.
  • In Los Angeles, a simple mammogram could cost anywhere from $86 to $954, an 11x price variance.
  • The San Francisco Bay Area ranged from $129 to $860, a 6x difference.

OB/GYN Follow-Up Visit. Minneapolis and Seattle were the most expensive cities for an OB/GYN follow-up visit, and Phoenix and Las Vegas were the cheapest.

Preventative Gynecological Exam. The San Francisco Bay Area was the priciest for both a preventative gynecological exam and an HPV test, where it was on average 6x more expensive than Charlotte, NC for both.

HPV Test. In Philadelphia, the price of an HPV test ranged from $32 to $626, a 19x difference.

Read More » »

Improper Payments Up 18 Percent, Mostly Medicare & Medicaid

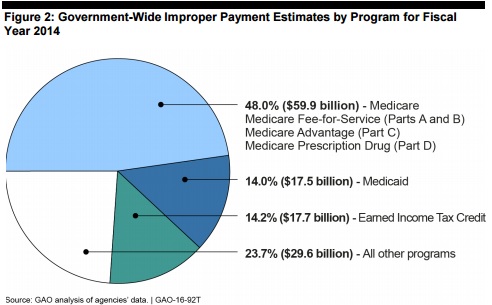
The Government Accountability Office (GAO) has just reported that “improper payments” (that is fraud and abuse) are up to $124. 7 billion in 2014 from $105.8 billion in 2013. Most of this is Medicare and Medicaid:

The almost $19 billion increase was primarily due to the Medicare, Medicaid, and Earned Income Tax Credit programs, which account for over 75 percent of the government-wide improper payment estimate. Federal spending in Medicare and Medicaid is expected to significantly increase, so it is critical that actions are taken to reduce improper payments in these programs.

GAO

Read More » »

Health Spending Increasing Share of GDP

BEALast week’s third estimate of Gross Domestic Product for the second quarter confirms that growth in health spending might be moderating somewhat from its initial Obamacare fueled rush. Unfortunately, it is not a clear break in the trend of health spending consuming an increasing share of our national income.

Current GDP grew $264.4 billion, or 1.5 percent, from Q1 (Table I). One tenth of this, $25.2 billion was health services. At this rate, health services grow in line with their share of GDP. However, if we look over the entire year from 2014, Q1, we note a trend that seems to be persisting, despite last quarter’s moderate grow (Table II). At $110.13, health services spending accounted for 17 percent of GDP growth over the four quarters. The rate of growth was 5.69 percent, in excess of current GDP growth.

Read More » »