Tag: "economic data"

CPI: Medical Prices Resume Upward March

BLSDue to vacation, I did not discuss June’s release of the Consumer Price Index for May, in which medical care prices were very moderate. This continued that which was observed in May (for the April CPI).

Unfortunately, prices for medical care resumed their upward march in the June CPI, released today. At 0.4 percent, prices for medical care increased twice as fast as the CPI for all items. Price changes for medical care contributed 16 percent of the price change for all items. Prescription drug prices, especially, resumed their increase. Prices for medical care services, on the other hand, were in line with the CPI for all items.

Over the last twelve months, prices for medical care have increased over four times faster than prices for all items other than medical care. Medical care price increases have contributed almost one third (29 percent) to the price increase of one percent for all items. Claims that consumers have experienced relief from medical prices are simply not grounded in data.
(See Table I below the fold.)

Read More » »

PPI: Health Prices Remain Tame

BLSAlthough I did not discuss June’s release of the Producer Price Index (PPI) for May at this blog (due to vacation), prices of pharmaceutical preparations did not increase at all. Similarly, they remained flat in today’s PPI release for June.

Prices for final demand goods (less food and energy), and prices for all final demand health services were either flat or down in June. Similarly, price changes of health services for final demand were all lower than price changes for final demand services overall. The same was true for both goods and services for intermediate demand.

For the last 12 months, prices of health goods and services (especially pharmaceutical preparations) have increased significantly more than prices of other goods and services, but the trend of disproportionately high health price increases might be breaking down.

(See Table I below the fold.)

Read More » »

Health Services Jobs Still Dominate Employment Growth

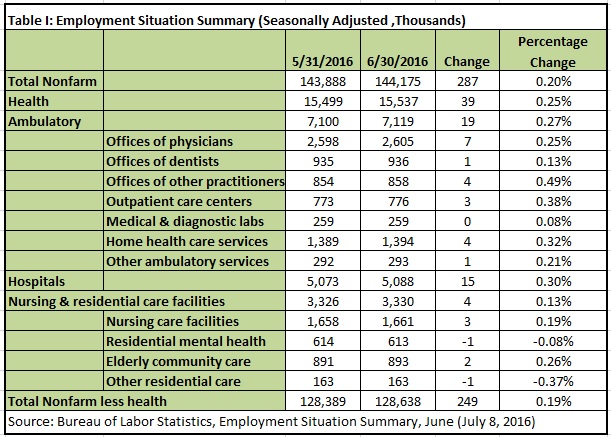
BLSLast Friday’s thrilling jobs report, which drove the stock market to new highs, continued to be dominated by growth in health services jobs. Indeed, breathless media coverage disguised that monthly job growth followed a miserable May report (which was actually revised downward last Friday).

Health services added just 39,000 jobs in June, significantly fewer than July. Nevertheless, those comprised 13 percent of 287 thousand civilian non-health, non-farm jobs added (Table I). The warping of our economy towards the government-controlled health sector continues.

20160708 TI

Read More » »

Health Facilities Exceed Other Construction in May

Census2April’s drop in health facilities starts looks to have been idiosyncratic. Health facilities exceeded other construction in May, as in March and February. While construction overall dropped at a seasonally adjusted annual rate of 0.8 percent, health construction increased 0.2 percent (See Table I below the fold).

The difference was especially apparent in private construction. Construction of private health facilities increased 0.5 percent, 0.8 percentage points more than other private construction, which declined.  Construction of public health facilities dropped 1.0 percent, but this was less than half the drop in other public construction.

For the twelve months from May 2015, there is a significant difference in trend between private and public construction. Private construction increased 4.7 percent, and private health facilities starts increased at almost exactly the same rate. However, while public construction declined 2.6 percent, public construction of health facilities dropped only 1.4 percent.

Overall, health construction increased 3.3 percent, versus only 2.8 percent for non-health construction. Notwithstanding other factors, this indicates health costs will continue to increase faster than other sectors of the economy because (as the old saying goes) “a bed built is a bed filled.”

Read More » »

Health Services 50 Percent of GDP Growth

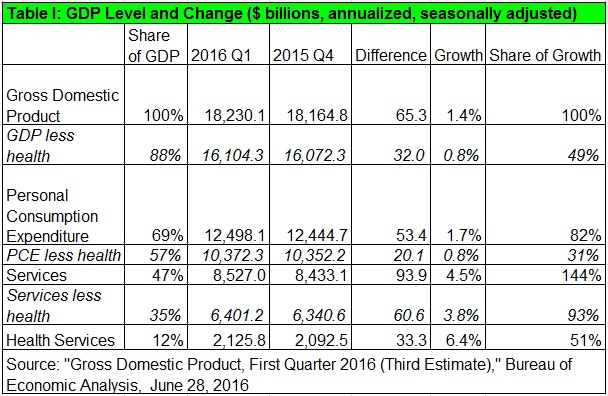
This morning’s third estimate of GDP for the first quarter significantly increased the estimate of health spending, such that it comprised one half of GDP growth in the first quarter.

Spending on health services continue to dominate weak GDP growth. Growth in health services spending of $33.3 billion (annualized) comprised 50 percent of GDP growth. However, there was shrinkage in personal consumption expenditures on goods and private domestic investment. This meant personal expenditures on services grew much more than GDP overall. Growth in spending on health services amounted to 62 percent of growth in personal consumption expenditures and 35 percent of spending on services. Spending on health services grew by 6.4 percent, almost twice as much as growth in spending on non-health services (Table I).

20160628 TI

Read More » »

QSS: Strong But Inconsistent Health Services Revenue Growth

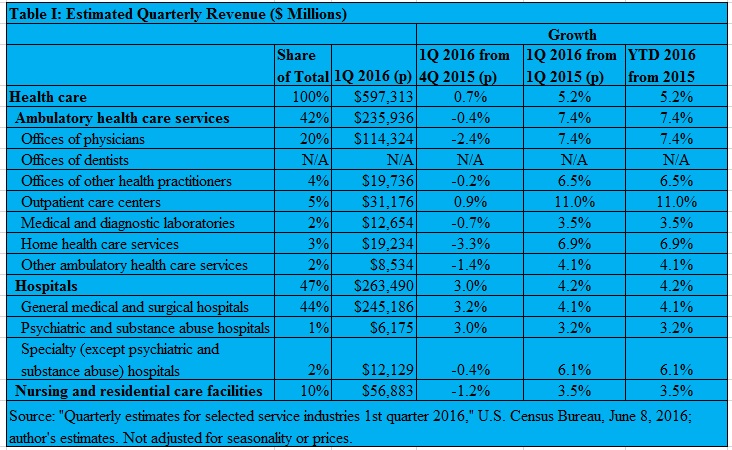
Census2This morning’s Quarterly Services Survey from the Census Department showed good growth in revenues for health services, but it was inconsistent within the industry. Overall, first quarter revenue grew 0.7 percent from the fourth quarter and 5.2 percent from the first quarter of 2015 (Table I).

20160608 TIA

Read More » »

Eight Thousand Non-Health Jobs Lost in May

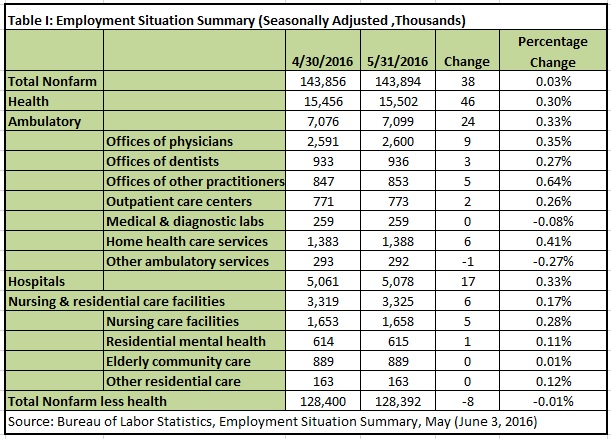
BLSThe true scope of this morning’s miserable jobs report is disguised by the headline figure of 38,000 jobs gained. In fact, health services added 46,000 jobs while civilian non-health, non-farm employment dropped eight thousand (Table I). The warping of our economy towards the government-controlled health sector has reached the tipping point I have suggested for months.

20160603 TI

Read More » »

Health Construction Boomlet Collapses in April

Census2The boomlet in health construction from February and March lost its wind in April. While construction overall dropped at a seasonally adjusted annual rate of 1.8 percent, health construction dropped by 3.0 percent (See Table I below the fold).

The drop was much greater for private than public health facilities, especially relative to other construction. Construction of private health facilities dropped 3.6 percent, 2.2 percentage points more than the decline in other private construction.  Construction of public health facilities dropped 0.8 percent, 2.1 percentage points less than the decline in other public facilities.

This turnaround after a two-month boomlet puts health construction back on the longer term trend. For the twelve months from April 2015, construction of non-health facilities boomed 4.7 percent versus a decline of 0.6 percent for health facilities. Notwithstanding other factors, this is welcome because it indicates a shift from inpatient to outpatient care at lower cost.

Read More » »

Health Services 30 Percent of GDP Growth

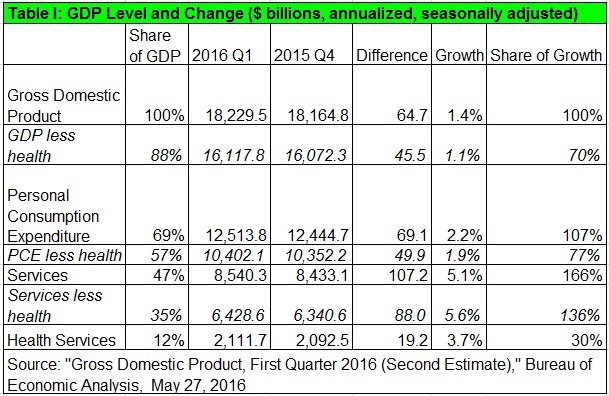
BEAThis morning’s second estimate of GDP for the first quarter was a little stronger than last month’s advanced estimate, although much of the adjustment was a smaller decrease in inventories than initially estimated.

Spending on health services continue to dominate weak GDP growth. Health services spending of $19.2 billion (annualized) comprised 30 percent of GDP growth. However, there was shrinkage in personal consumption expenditures on goods, private domestic investment, and exports. This meant personal expenditures on services grew much more than GDP overall. Growth in spending on health services amounted to a little less than one fifth of growth in services spending. Nevertheless, the quarterly growth in spending on health services indicates health services continues to consume a disproportionate share of (low) growth (Table I).

20160527 TI

Read More » »

CPI: Medical Inflation Finally Under Control

BLSThe Consumer Price Index (CPI) for April confirmed medical inflation is matching the broad measure of price changes. For the second month, price changes for medical care (0.3 percent) were in line with all-items (0.4 percent). Although, it looks like a jump in energy prices drove the CPI up. If energy price increases moderate, we can expect prices for medical care to increase faster than CPI.

With respect to medical commodities, it prices of prescription drugs continued to increase faster than other medical commodities or commodities over all. Although, pharmaceutical price hikes in the CPI are not as big as in the Producer Price Index. Prices for many health goods and services actually dropped.

However, over the last twelve months, medical prices faced by consumers have grown much faster than non-health prices: 3.0 percent versus 1. percent. Prescription prices increased 4.0 percent, as did prices for inpatient hospital services. Health insurance increased 5.8 percent.

(See Table I below the fold.)

Read More » »