Tag: "economic data"

Health Jobs Dominate Terrible Jobs Report

No good words were used to describe last week’s Employment Situation Summary: “Every aspect of the September jobs report was disappointing,” wrote Michelle Girard, chief U.S. economist at RBS (quoted in Forbes). This is largely a repeat of the August jobs report, although those and previous months’ figures were also revised downwards.

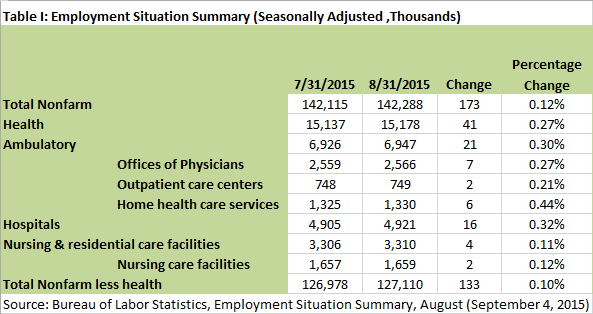
One quarter of September’s new jobs were in health services: 34,000 of 142,000 added to nonfarm payrolls (see Table II). Of those 34,000 health jobs, 37 percent were in ambulatory facilities, and 45 percent in hospitals. This is a change from the last few months. Because of a long-term shift in the location of care, there are now almost seven million people working in ambulatory settings, versus just under five million working in hospitals.

Read More » »

Health Construction Picks Up in August

After a few months lagging behind other construction, health facilities starts finally showed some life in August (See Table I). Although on a twelve-month basis health facilities construction is still running slower than the booming construction market overall, health construction grew by 1.9 percent from July. Other construction grew by only 0.6 percent.

20151002 Construction

When looking only at private construction, health facilities and other building starts are at about the same rate of growth for the twelve-month period. However, health facilities construction grew three times faster – 2.1 percent versus 0.7 percent – than other building starts over one month.

Read More » »

Health Spending Increasing Share of GDP

BEALast week’s third estimate of Gross Domestic Product for the second quarter confirms that growth in health spending might be moderating somewhat from its initial Obamacare fueled rush. Unfortunately, it is not a clear break in the trend of health spending consuming an increasing share of our national income.

Current GDP grew $264.4 billion, or 1.5 percent, from Q1 (Table I). One tenth of this, $25.2 billion was health services. At this rate, health services grow in line with their share of GDP. However, if we look over the entire year from 2014, Q1, we note a trend that seems to be persisting, despite last quarter’s moderate grow (Table II). At $110.13, health services spending accounted for 17 percent of GDP growth over the four quarters. The rate of growth was 5.69 percent, in excess of current GDP growth.

Read More » »

Consumer Price Index: Amid Disinflation, Medical Prices Increasing

BLSYesterday’s Consumer Price Index (CPI) release confirmed prices of medical goods and services continue to rise at a steady pace, despite the general deflationary environment. The CPI declined 0.1 percent from July to August (seasonally adjusted), and increased just 0.2 percent in the last twelve months.

Much of the disinflation is caused by dropping energy prices. Excluding food and energy, the CPI increased 0.1 percent last month and 1.8 percent over the last twelve months. Medical care, although flat last month, increased 2.5 percent over the last twelve months (see Table I). This is moderate by historical standards, but still excessive relative to current CPI.

Read More » »

PPI: Gap in Hospital Inpatient & Outpatient Prices

BLSAugust’s Producer Price Index was flat, month on month, and dropped 0.8 percent, year on year, continuing the trend we saw last month. Producer prices for health goods and services are rising faster than other producer prices (see Table I).

20150911 TI

Read More » »

Hospital Margins Up 9 Percent

This morning’s Quarterly Services Survey (QSS), published by the Census Bureau, reported that:

The estimate of U.S. health care and social assistance revenue for the second quarter of 2015, not adjusted for seasonal variation, or price changes, was $591.3 billion, an increase of 2.2 percent (± 0.8%) from the first quarter of 2015 and up 6.4 percent (± 1.3%) from the second quarter of 2014. The fourth quarter of 2014 to first quarter of 2015 percent change was revised from -0.4 percent (± 1.1%) to -0.5 percent (± 1.1%).

The QSS adds important information to the more widely reported quarterly Gross Domestic Product (GDP) and Employment Situation Summary (ESS) releases that I frequently discuss on the blog.

Read More » »

Health Care One Quarter of August Job Growth

This morning’s Employment Situation Summary, which showed slow job growth overall, contained a big jump for health services: 23 percent of last month’s jobs were in health services (see Table I).

TI

Of the 41,000 health jobs, a little more than half were in ambulatory settings. Because of a long-term shift in the location of care, there are now almost seven million people working in ambulatory settings, versus just under five million working in hospitals. This is a positive development.

Read More » »

Health Facilities Lag Booming Building Market

This morning’s release of a booming construction report from the Census Bureau once again shows lagging spending on new health facilities, especially in the public sector (see Table I).

20150901 TI

Read More » »

A Welcome Break – Moderate Health Spending Growth in Q2 GDP

Last week’s second estimate of Gross Domestic Product for the second quarter confirms that growth in health spending took a welcome break. Unfortunately, it is not a clear break in the trend of health spending consuming an increasing share of our national income.

When we compare 2015 Q2 to 2014 Q2 annualized spending, health care is still consuming a slightly disproportionate share of GDP. Health spending grew $106 billion, comprising 17 percent of the $632 billion change in GDP. GDP only grew 3.66 percent, while health spending grew 5.47 percent.

Read More » »

Health-Related Producer Prices Tame in July

BLSThe Producer Price Index (PPI) for July increased more than expected, but was still benign. Health-related producer prices were tame last month.

Prices for pharmaceutical preparations, which have increased faster than other producer goods in the long term (rising 9.4 percent since July 2014), finally turned around and actually dropped 0.4 percent last month (See Table I). This was a bigger decline than prices for all final demand goods (-0.1 percent) or for all final demand (0.2 percent).

Read More » »