Search Results for 'producer price index'

PPI: Health Prices Remain Tame

BLSAlthough I did not discuss June’s release of the Producer Price Index (PPI) for May at this blog (due to vacation), prices of pharmaceutical preparations did not increase at all. Similarly, they remained flat in today’s PPI release for June.

Prices for final demand goods (less food and energy), and prices for all final demand health services were either flat or down in June. Similarly, price changes of health services for final demand were all lower than price changes for final demand services overall. The same was true for both goods and services for intermediate demand.

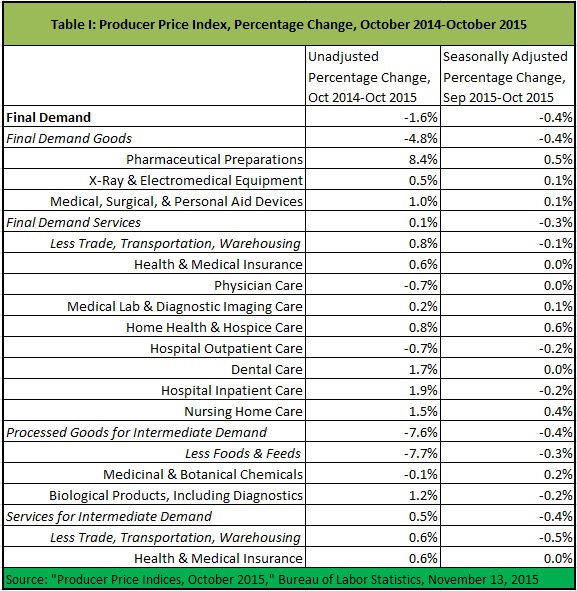
For the last 12 months, prices of health goods and services (especially pharmaceutical preparations) have increased significantly more than prices of other goods and services, but the trend of disproportionately high health price increases might be breaking down.

(See Table I below the fold.)

PPI: Pharma Price Hikes Continue To Stand Out

BLSThe Producer Price Index (PPI) for final demand goods grew 0.2 percent last month, or 0.3 percent less food and energy. Prices for pharmaceutical preparations and most medical devices grew significantly faster, at 1.0 percent and 0.5 percent, although prices for X-Ray and similar equipment were flat.

With respect to final demand services, for which prices rose 0.1 percent (or 0.3 percent, less trade, transportation, and warehousing), prices of medical services changed similarly. However, prices for health insurance jumped 0.8 percent.

With respect to goods for intermediate demand, which dropped 0.3 percent, price increases for biologics, including diagnostics, stood out at 2.5 percent. With respect to services for intermediate demand, which rose 0.1 percent, prices for health insurance jumped 0.8 percent

Looking back over the 12-month period, the price increase of 10.4 percent for pharmaceutical preparations continues to stand out like a sore thumb. Political agitation against drug prices is unlikely to go away soon. Health insurance, having risen 1.7 percent in a flat or negative inflationary environment, is also beginning to stand out. (See Table I below the fold.)

CPI: Most Medical Price Hikes Stall

BLSThe Consumer Price Index for March indicates that medical price inflation matched changes in other prices charged to consumers, with a slight uptick of 0.1 percent. Prescription drugs (0.5 percent increase), nursing homes and adult day care, eyeglasses, and health insurance (all with 0.4 percent increases) stood out as continuing to experience higher inflation than other items. Prices for many health goods and services actually dropped.

However, over the last twelve months, medical prices faced by consumers have grown much faster than non-health prices: 3.3 percent versus 0.6 percent. Prescription prices increased 3.4 percent. However, inpatient hospital services and health insurance prices increased much faster, by 5.9 percent and 6.0 percent.

When we compare the medical components of the CPI with those in the Producer Price Index, it appears that hospitals, not drug makers, are shifting more prices directly onto consumers.

(See Table I Below the fold.)

PPI: Pharmaceutical Prices Up Amid Deflation

BLSDeflation in the Producer Price Index (PPI) continued last month, as the PPI for final demand dropped 0.1 percent from February. Prices for final demand goods, less volatile food and energy, increased 0.2 percent. Most prices for health goods for final demand were flat. The exception – again – was pharmaceutical preparations, for which prices increased 0.4 percent.

With respect to final demand services, for which prices dropped 0.2 percent (or increased just 0.1 percent, less trade, transportation, and warehousing), prices of medical services changed little. Even the price of health insurance remained flat, after an increase in February.

With respect to goods for intermediate demand, prices for chemicals (which go into pharmaceutical preparations) increased by just 0.1 percent, while prices of biologic products (including diagnostics) dropped the same percentage. With respect to services for intermediate demand, prices for health insurance remained flat, although prices for other intermediate services declined.

Looking back over the 12-month period, the price increase of 9.8 percent in pharmaceutical preparations continues to stand out like a sore thumb. Political agitation against drug prices is unlikely to go away soon. (See Table I below the fold.)

PPI: Physician Prices Pull Back

BLSDecember’s surprising jump in physician prices looks to have been idiosyncratic. January’s Producer Price Index for physician services declined 0.6 percent, versus a 0.5 percent rise in prices of final demand services. Prices for home health and hospice care increased 0.7 percent on the month. However, other prices for final demand health services were in line with other services inflation.

For final demand goods, prices for pharmaceutical preparations increased 1.6 percent, versus zero change for final demand goods less food and energy. (When the next Consumer Price Index is released on February 19, we will see whether the divergence between pharmaceutical prices in the PPI and CPI continues.) With respect to intermediate demand goods, prices of biologics, including diagnostics, increased 1.1 percent, versus a 1.3 percent decline in prices of processed goods, less foods and feeds.

It does not look like complaints about high and increasing prices for pharmaceuticals and biologics will be going away soon. (See Table I below the fold.)

CPI: Prescription Prices Finally Drop Amid General Deflation

BLSMedical prices grew 0.1 percent, versus a decrease of 0.1 percent for all other items, in December’s Consumer Price Index. Prices for prescription drugs actually decreased 0.3 percent, even better than the small price increase in the Producer Price Index (PPI).

Prices for physicians’ services were flat, however, whereas they had jumped in the PPI. Because CPI measures prices as observed by consumers and PPI prices as observed by producers, this suggests that prices paid to physicians by non-consumers (i.e., third parties) have increased more than prices paid by consumers. This supports the principle that when consumers face prices directly, prices go up less than when intermediated by third parties.

Overall, medical care inflation was tame in December. Longer term, it still significantly outpaced the CPI other than medical care, by two percent over the year (Table I).

PPI: Physician Prices Jump Amidst Deflation

BLSThe stock market took a hit this morning, as the Producer Price Index turned back to deflation, dropping 0.2 percent in December and 0.1 percent in 2015 (Table I). Health prices are still growing faster than other prices. This is especially true for pharmaceuticals, for which prices increased 8.2 percent last year, versus a 3.7 percent decline in prices for final demand goods. Although political attacks on pharmaceutical prices are misguided, it is likely they will continue as long as this situation persists.

With respect to services, health price inflation is not as extreme. However, the jump of 1.3 percent for physician prices in December is remarkable.

CPI: Hospitals Under Pressure As Physician Prices Rise

BLSNovember’s Consumer Price Index (CPI) indicates health prices are moderating, though still increasing higher than non-heath consumer goods. In the third piece of bad news for hospitals (from their perspective, at least, after the Quarterly Services Survey and the Producer Price Index), prices for hospital services actually dropped (See Table I).

PPI: Pharmaceutical Prices Finally Tame In November

BLSNovember’s Producer Price Index (PPI) finally saw a slowdown in pharmaceutical price increases, which increased 0.3 percent, month on month. This was the same as the overall PPI increase. Price increases for health goods and services were very slight, compared to general PPI. Indeed, two categories (X-Ray & electromedical equipment and biological products including diagnostics) actually experienced price deflation (see Table I).

PPI: Health Prices Continue to Rise Faster Than Others

October’s Producer Price Index declined 0.4 percent, month on month, and dropped 1.6 percent, year on year. Mild deflation continues to take hold in the general economy. However, it is not so in health care. Of the 14 sub-indices for health-related goods and services, only three declined month on month. Only six declined year on year (see Table I).

20151113 PPIa