PPI: Health Prices Mixed, Inflation Low
 February’s Producer Price Index rose 0.3 percent. However, prices for many health goods and services grew slowly, if at all. Nine of the 16 price indices for health goods and services grew slower than their benchmarks.* Prices for medical lab and diagnostic imaging actually deflated in absolute terms.
Even pharmaceutical preparations for final demand, for which prices increased most relative to their benchmark, increased by just 0.4 percent. Although 0.3 percentage points higher than the price change for final demand goods less food and energy (0.1 percent), this is still tame relative to the trend of pharmaceutical prices. Among services for final demand, only price for health insurance and nursing homes rose higher than their benchmark.
With respect to diagnosing whether health prices are under control, the February PPI is about as mixed as January’s was.
See Table I below the fold:
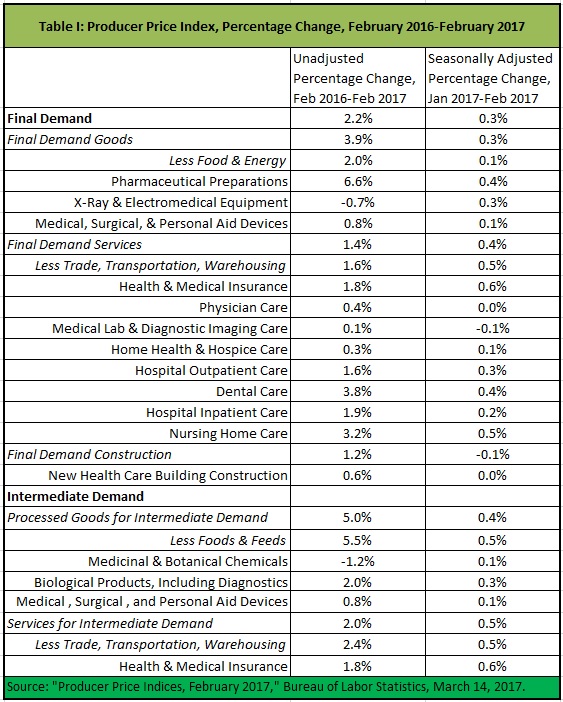
Over the last twelve months, prices of 10 of the 16 health goods and services have increased slower than their benchmarks. Prices of X-Ray and electromedical equipment stand out, having shrunk 0.7 percent, an absolute decline of 2.7 percentage points versus final demand goods (less food and energy). Pharmaceutical preparations stand out on the high side, having increased 6.6 percent, or 4.6 percentage points more than final demand goods (less food and energy). On the other hand, prices for medicinal and botanical chemicals declined 1.2 percent, 6.7 percentage points more than processed goods for intermediate demand, less foods and feed.
The Consumer Price Index will be published tomorrow.
*The benchmarks are the core measurements under which the health measurements are found. That is, final demand goods less food and energy is the benchmark for the three measurements (pharmaceutical preparations, X-Ray and electromedical equipment, and medical, surgical, and personal aid devices) listed under that core measurement; final demand services less trade, transportation, and warehousing is the benchmark for the eight health measurements listed under that core measurement, et cetera.
**Dental care is dominated neither by government nor private insurance, so dental price increases are not explained by NCPA’s usual theory of health inflation. I addressed dental price increases in a previous article.


John I really appreciate these updates. They are informative and useful to me,
And I think it’s also worth noting they seldom atteact a long string of comments. Perhaps because facts are hard to argue about?